klee12
Oct 4, 2020
Writing Feedback / Task 1: Bar chart (Timeline) - Annual average spending on 4 types of clothes per person in the US [3]
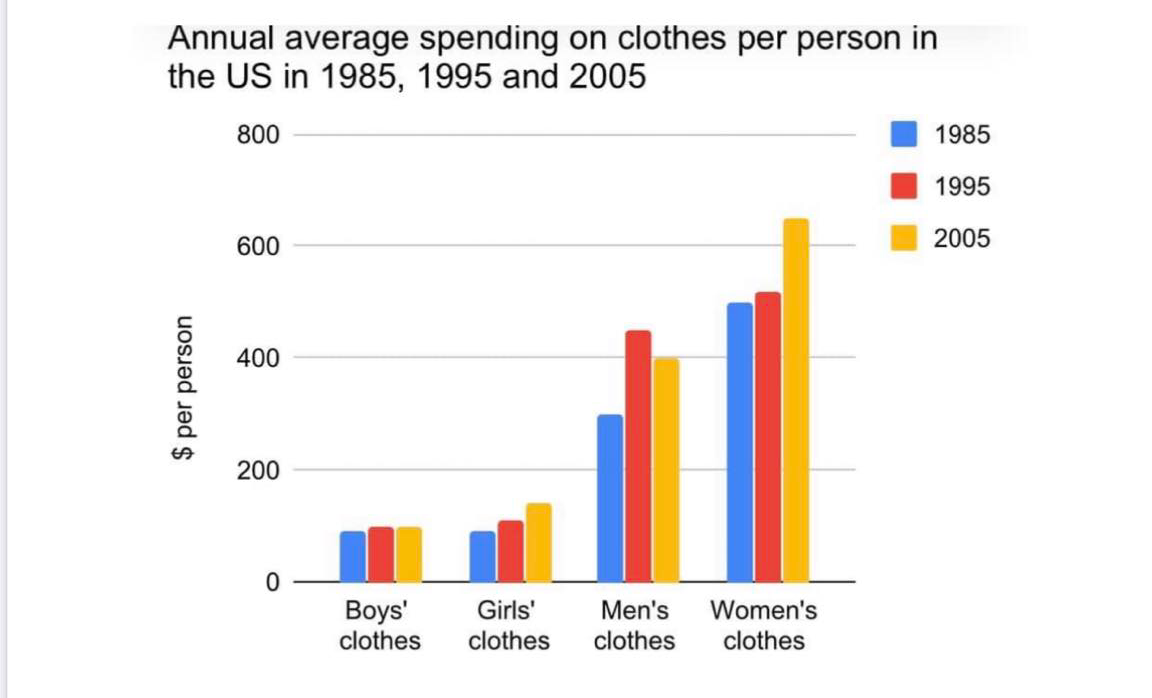
The bar chart describes how much money people in the US spent on distinct types of clothing in three years 1985, 1995 and 2005.
It can be seen from the chart, women clothing was the highest expenditure all the times. In contrast, there was a stability of money spending on boys' clothes at the same time.
Regarding children's clothing, the average money of spending on boys' clothes was equal to the figure for girls' clothes, about $150 between 1985 and 1995. However, after few years later, in 2005, girls' clothing was consumed more than boys' clothes, about $170.
As for adult's clothing, the amount of money using for males' clothes was lower than for females' clothes. Although the average money spending on male clothing was quite catch up the figure for female clothing in 1995 with $420 and $430 respectively, there was a wide distance between the expenditure of men's clothes and women's clothes in 2005.
Overall, what stand out from the chart is that the demand of women clothing was always highly requirement which pointed out from the most spending on in the previous years.
<Thank you for viewing my report!!! Im looking forward to your assessments.>
$ per person for clothing in three different years
The bar chart describes how much money people in the US spent on distinct types of clothing in three years 1985, 1995 and 2005.
It can be seen from the chart, women clothing was the highest expenditure all the times. In contrast, there was a stability of money spending on boys' clothes at the same time.
Regarding children's clothing, the average money of spending on boys' clothes was equal to the figure for girls' clothes, about $150 between 1985 and 1995. However, after few years later, in 2005, girls' clothing was consumed more than boys' clothes, about $170.
As for adult's clothing, the amount of money using for males' clothes was lower than for females' clothes. Although the average money spending on male clothing was quite catch up the figure for female clothing in 1995 with $420 and $430 respectively, there was a wide distance between the expenditure of men's clothes and women's clothes in 2005.
Overall, what stand out from the chart is that the demand of women clothing was always highly requirement which pointed out from the most spending on in the previous years.
<Thank you for viewing my report!!! Im looking forward to your assessments.>

120771652_2573190622.png
