Thao Vy
Mar 10, 2021
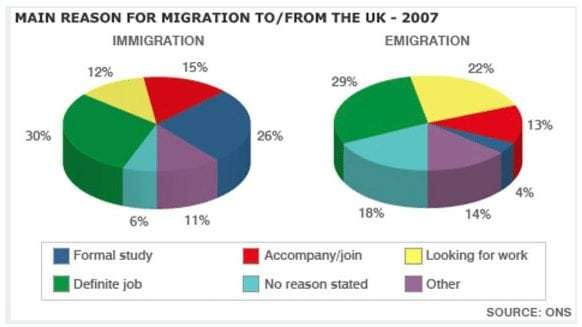
Writing Feedback / The pie charts show the main reasons for migration to and from the UK in 2007. [2]
The given charts demonstrate the percentage of different reasons for immigration and emigration in England in the year 2007.
As can be seen from the pie charts, it is obviously evident that while the most popular cause for residents arriving from and to the UK was their occupation, the immigration for no reason as well as the emigration for studying abroad were the lowest proportion.
As the illustration suggests, the definite job reason for both migrations represented the majority of total, equivalent to about a third. The allocation of formal study cause accounted for 26%, which was higher than the accompany reason nearly a half figure. Seeking jobs and other reasons were the fourth rates, made up similarly the allocation of 12%. This number was obviously double that of no reason stated for British people moving to this country.
According to the emigration chart, looking for work and no reason stated occupied 22% and 18% respectively. An interesting notice is that the proportions of joining reason as well as others constituted approximately 13%, which tripled that of formal study.
Uk - immigration and migration statistics
The given charts demonstrate the percentage of different reasons for immigration and emigration in England in the year 2007.
As can be seen from the pie charts, it is obviously evident that while the most popular cause for residents arriving from and to the UK was their occupation, the immigration for no reason as well as the emigration for studying abroad were the lowest proportion.
As the illustration suggests, the definite job reason for both migrations represented the majority of total, equivalent to about a third. The allocation of formal study cause accounted for 26%, which was higher than the accompany reason nearly a half figure. Seeking jobs and other reasons were the fourth rates, made up similarly the allocation of 12%. This number was obviously double that of no reason stated for British people moving to this country.
According to the emigration chart, looking for work and no reason stated occupied 22% and 18% respectively. An interesting notice is that the proportions of joining reason as well as others constituted approximately 13%, which tripled that of formal study.

IELTSAcademicTask.jpg
