duongmy2106
Jul 11, 2021
Writing Feedback / The proportion of people's expenditure on six different goods and services in a European country [2]
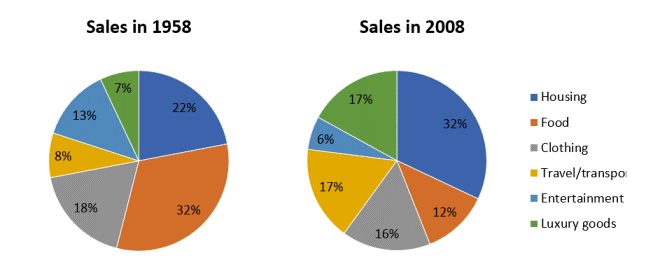
The pie charts give information about the proportion of people's total expenditure on six different goods and services in a European country between 1958 and 2008. Overall, it is clear that spending on housing, travel and luxury goods increased while that of food, clothing and entertainment decreased over the period of 50 years.
Beginning with the percentage of people's total spending on housing in 1958, it accounted for 22%. Then 50 years later, this figure rose and housing became the biggest expense with 32%. Similarly, the expenditure on transport saw a considerable increase from 8% in 1958 to 17% in 2008. In addition, people just spent 7% of expense on luxury goods in 1958, but 50 years later the total grew remarkably to nearly one fifth.
In 1958, people spent the largest portion on food, with nearly one third. However, in 2008, the spending on food was a small minority in the total. The proportion of clothing witnessed a minimal decline from 18% to 16% during the period of 50 years. Similarly, the expenditure on entertainment in 1958 was 13%, but later fell to 6% in 2008.
the proportion of people's total spending in a particular European country
The pie charts give information about the proportion of people's total expenditure on six different goods and services in a European country between 1958 and 2008. Overall, it is clear that spending on housing, travel and luxury goods increased while that of food, clothing and entertainment decreased over the period of 50 years.
Beginning with the percentage of people's total spending on housing in 1958, it accounted for 22%. Then 50 years later, this figure rose and housing became the biggest expense with 32%. Similarly, the expenditure on transport saw a considerable increase from 8% in 1958 to 17% in 2008. In addition, people just spent 7% of expense on luxury goods in 1958, but 50 years later the total grew remarkably to nearly one fifth.
In 1958, people spent the largest portion on food, with nearly one third. However, in 2008, the spending on food was a small minority in the total. The proportion of clothing witnessed a minimal decline from 18% to 16% during the period of 50 years. Similarly, the expenditure on entertainment in 1958 was 13%, but later fell to 6% in 2008.

Screenshot83.png
