Writing Feedback /
IELTS Writing Task 1: People arrested in the five years and the most recent reasons for arrest [4]
Hey Guys! Could you help me check and rate my essay? Anything else I can do to improve my writing?
You should spend about 20 minutes on this task.
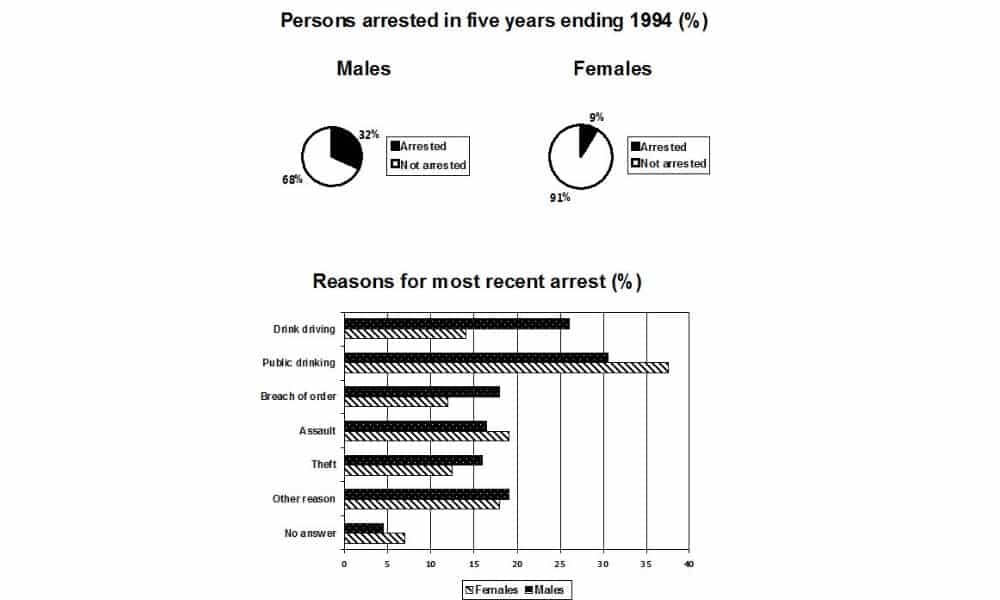
The pie chart shows the percentage of persons arrested in the five years ending 1994 and the bar chart shows the most recent reasons for arrest.
Summarize the information by selecting and reporting the main features and make comparisons where relevant.
Write at least 150 words.The pie charts delineate the percentage of offenders arrested from 1989 to 1984, five years, while the bar chart demonstrates apprehend reasons.Overall, males were arrested more than females. The majority of wrongdoers were captured since they drank in public; in contrast, the least percentage was accounted for inconclusive factors.
Almost one-tenth of women were arrested, which quartered from men figures. Most people were caught because of public drinking. Women were approximately 37, which was higher than that of men (around 6%). It was followed by intoxicated while driving. This action was taken by over 25% of males, which were more than two times of females' percentage. The third reason was assaulting and other causes. Both activities illustrated similar percentages.
Transgressing the rule displays around 18% of males and 12% of women, ranked the fourth. However, the same number of females were indicated by being robbers, but males' number was 16% (different from man's number in breach of order). Nevertheless, there are a few individuals seized with ambiguity reasons.

76811.jpg

