Writing Feedback /
IELTS 1: The bar chart depicts data about how many tons of waste was collected by recycling centre [3]
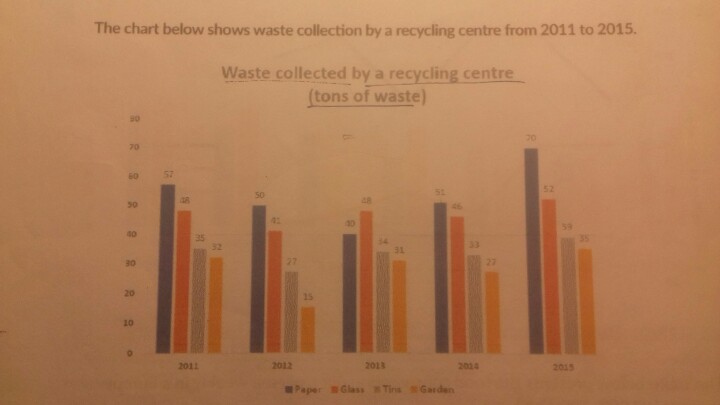
The chart below show waste collection by a recycling centre from 2011 to 2015
The bar chart depicts data about how many tons of waste was collected by recycling centre between 2011 and 2015, namely in paper, glass, tins and garden.
Overall, what stands out most from the graph is that waste of garden always ranked final position among four mentioned type of waste and all of waste consistently fluctuated over 4-year period.
It can be clearly observed that in 2012 the number of tons of garden nearly halved about 15 tons to nearly 30 tons, compared to those of garden in 2011 and 2013. Following that the amount of paper in 2012 was roughly equal to those in 2014, at approximately 51 tons, whereas in 2015 the number of paper reached the highest point of 70 tons over the course of four year.
It could be noticed that the number of tins remained almost constant from 2013 to 2015, but was higher than those of garden. There are some significant changes in amount of glass from 2011 to 2015 which hit low of 46 tons in 2014.
Thanks for reading my essay^^

905e78f3ece21abc43f3.jpg

