Pham
Sep 22, 2021
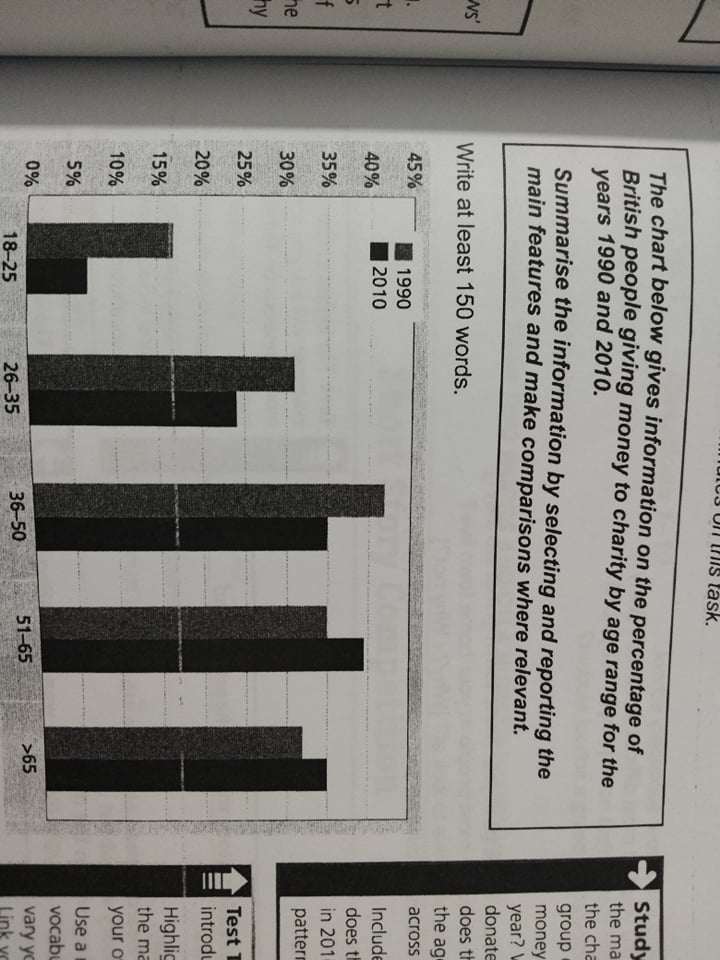
Writing Feedback / The chart below gives information on the per of British people giving money to charity by age range. [NEW]
The bar chart compares the number of British people who gave money to charity from 18 to over 65 years old, between 1990 and 2010.
Overall, people about 25 to 50 years old spent money on charity was higher than others. And from 18 to 25 years old people who gave money to charity lower than others.
In 1990, we can see the percentage of people from 35 to 50 years old spent money on for poor people was high at around 42 percent, the young people just about 17 percent. People who have aged from 51 to 65 was spent money on charity at around 35 percent.
In 2010, the number changed slightly the people from 51 to 65 years old have the percentage giving money to charity is the highest. While the young people just giving money to charity just only 5 percent.
Finally, we can see the bar chart changes from 1990 to 2010.

pls see help me
pls see help me
