drcyyy
Jun 20, 2022
Writing Feedback / The chart illustrates the amount of waste that was disposed and how they changed (2005 - 2008) [2]
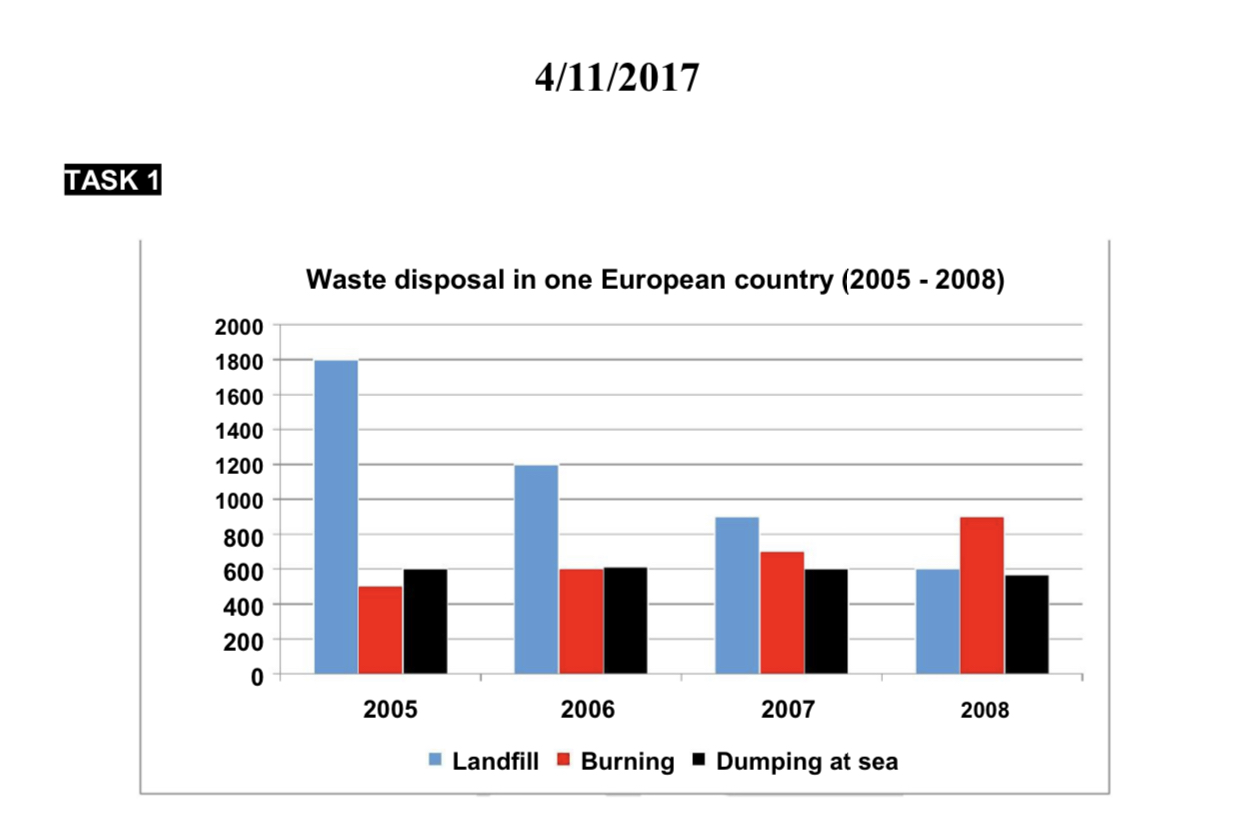
The chart illustrates the amount of waste that was disposed of in landfill, burning, the dumping at sea and how they changed between 2005 and 2008 in a particular European country.
Overall, it can be seen that while landfill was the main reason for waste disposal and burning was the least. However, the trend slowly reversed over the 3 - year period.
The number of poison from landfill started at exactly 1800 million tonnes in 2005, after which it saw a significant decline to precisely 1200 in 2006 and then continued to drop habitually to the north of 900 in 2007 and the final amount was 600 million tonnes in 2008. By contrast, the figure for burners or fuels rose indefectly from just under 500 million tonnes in 2005 to approximately 900 million tonnes after 3 years.
For the level of dumping at sea, it increased slightly from 600 to 650 million tonnes in 2006 before dropping gently to around 550 million tonnes in 2008. This was the only one which remained unchanged through the time.
waste disposal in one european country
The chart illustrates the amount of waste that was disposed of in landfill, burning, the dumping at sea and how they changed between 2005 and 2008 in a particular European country.
Overall, it can be seen that while landfill was the main reason for waste disposal and burning was the least. However, the trend slowly reversed over the 3 - year period.
The number of poison from landfill started at exactly 1800 million tonnes in 2005, after which it saw a significant decline to precisely 1200 in 2006 and then continued to drop habitually to the north of 900 in 2007 and the final amount was 600 million tonnes in 2008. By contrast, the figure for burners or fuels rose indefectly from just under 500 million tonnes in 2005 to approximately 900 million tonnes after 3 years.
For the level of dumping at sea, it increased slightly from 600 to 650 million tonnes in 2006 before dropping gently to around 550 million tonnes in 2008. This was the only one which remained unchanged through the time.

task118.06.PNG
