hoanglinh220301
Jun 24, 2022
Writing Feedback / Energy consumption by the fuel - line chart in ielts writing task 1 [3]
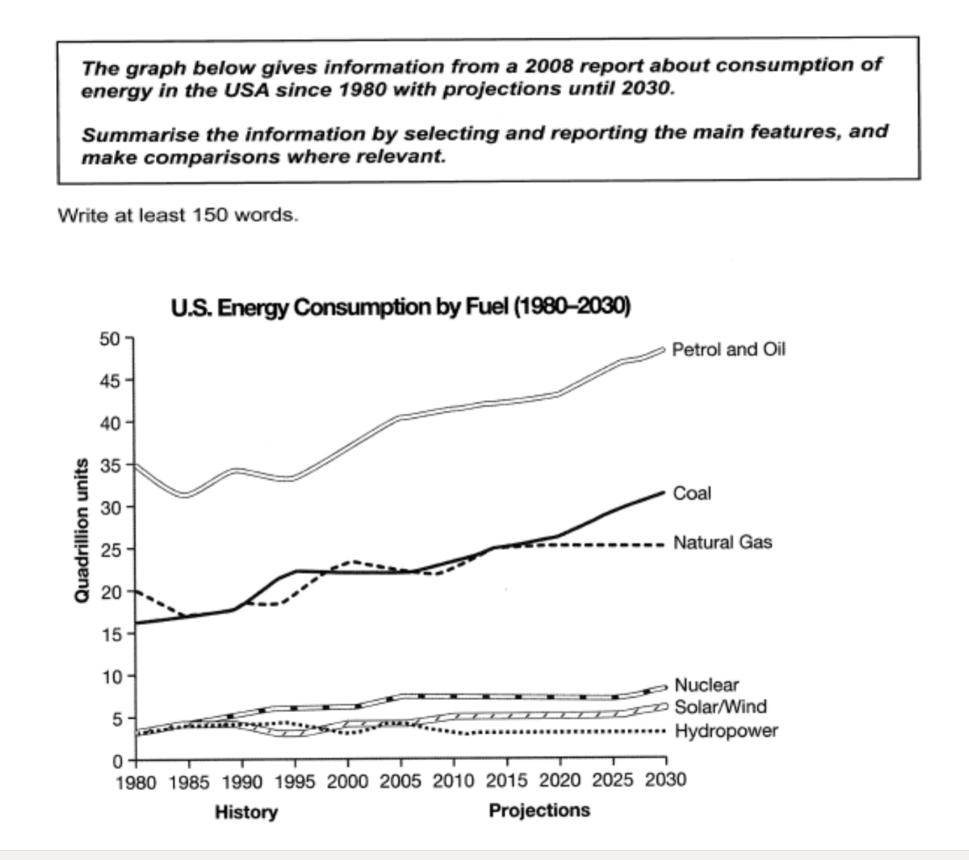
The line graph illustrates the energy consumption by the fuel of the United States from 1980 to 2030.
Overall, petrol and oil were consumed the most, and they have burgeoned from 1990 until 2030. Although coal was not used as much as petrol and oil, its development rate still increases from 1980 to now. The other fuels do not fluctuate too much, most of them were stably expended.
Nuclear, solar/wind and hydropower remain below 15 quadrillions. Hydropower was expended at least, it fluctuated from 1980 to 2010 but after that, this fuel does not have many changes. Nuclear and solar/wind have little change before 2005, then they stay level of expending, finally, they have some sign of progress from 2025.
Coal and natural gas are the second most common fuel. While coal rises every year, the development rate of natural gas is not volatile since 2015.
Petrol and oil dropped to 30 quadrillions in 1985, however, it develops stably until now. In addition, petrol and oil increase quickly between 1995 and 2020. The highest consumption is predicted about 50 quadrillions in 2030.
us energy chart
The line graph illustrates the energy consumption by the fuel of the United States from 1980 to 2030.
Overall, petrol and oil were consumed the most, and they have burgeoned from 1990 until 2030. Although coal was not used as much as petrol and oil, its development rate still increases from 1980 to now. The other fuels do not fluctuate too much, most of them were stably expended.
Nuclear, solar/wind and hydropower remain below 15 quadrillions. Hydropower was expended at least, it fluctuated from 1980 to 2010 but after that, this fuel does not have many changes. Nuclear and solar/wind have little change before 2005, then they stay level of expending, finally, they have some sign of progress from 2025.
Coal and natural gas are the second most common fuel. While coal rises every year, the development rate of natural gas is not volatile since 2015.
Petrol and oil dropped to 30 quadrillions in 1985, however, it develops stably until now. In addition, petrol and oil increase quickly between 1995 and 2020. The highest consumption is predicted about 50 quadrillions in 2030.

Screenshot215.png
