chemistryforever
Jul 1, 2022
Writing Feedback / Writing task 1 - line graph - illustrates the amount of spreads consumed from 1981 to 2007, in grams [2]
Summarize the information by selecting and reporting the main features and make comparisons where relevant.
Write at least 150 words.
The line graph below compares the quantity of spreads was consumed over a period of 26 years.
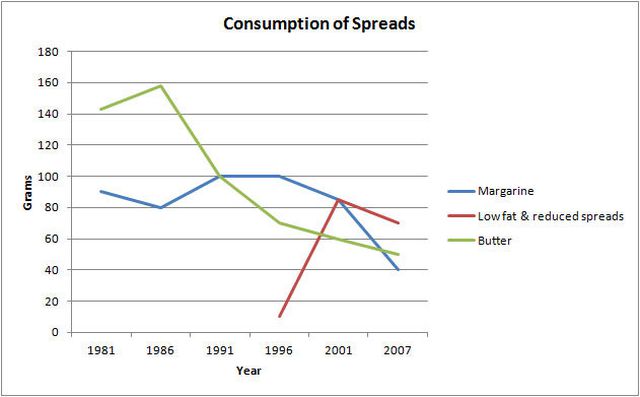
Overall, the amount of margarine and butter declined , while the consumption of low-fat spreads increased significantly.
At first , butter was consumed the most ; however ; at the end of the period , the consumption of low-fat and reduced spreads was the biggest and seemed set to continue.
In 1981, butter was consumed the most with the amount around 142 grams and the consumption reached a peak of about 160 grams in 1986. After this , there was a sharp decline .The consumption of margarine has a slightly growth from the beginning and till 1996 , the quantity of margarine decreased markedly. Low-fat spreads were introduced in 1986 and they saw a rapidly rise in their consumption from that time so that they were consumed the most in 2001.After 2001 , there was a steady downward trend.
The line graph illustrates the amount of spreads consumed from 1981 to 2007, in grams.
Summarize the information by selecting and reporting the main features and make comparisons where relevant.
Write at least 150 words.
The line graph below compares the quantity of spreads was consumed over a period of 26 years.
Overall, the amount of margarine and butter declined , while the consumption of low-fat spreads increased significantly.
At first , butter was consumed the most ; however ; at the end of the period , the consumption of low-fat and reduced spreads was the biggest and seemed set to continue.
In 1981, butter was consumed the most with the amount around 142 grams and the consumption reached a peak of about 160 grams in 1986. After this , there was a sharp decline .The consumption of margarine has a slightly growth from the beginning and till 1996 , the quantity of margarine decreased markedly. Low-fat spreads were introduced in 1986 and they saw a rapidly rise in their consumption from that time so that they were consumed the most in 2001.After 2001 , there was a steady downward trend.

162921db88.jpeg
