phamthao0710
Nov 18, 2022
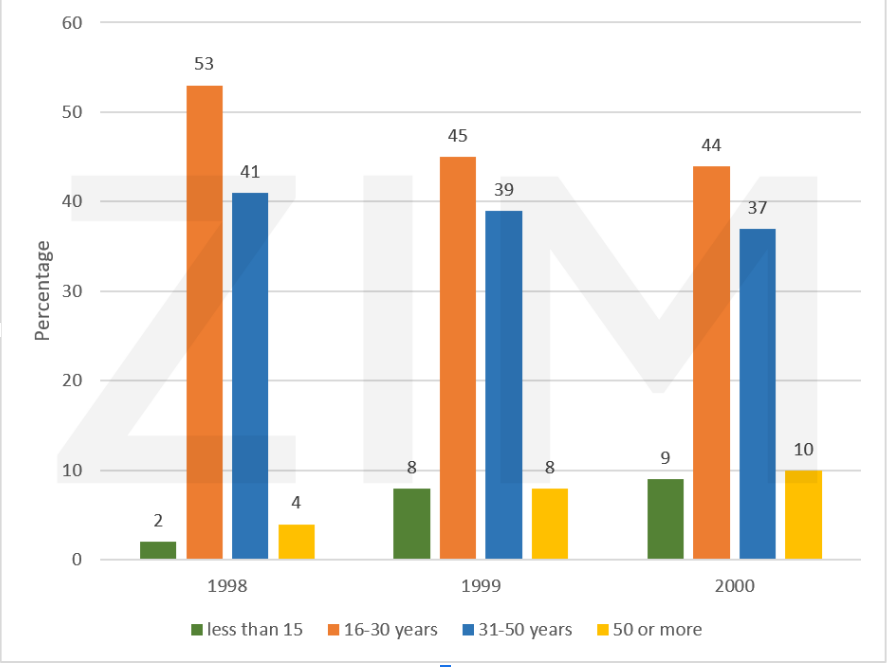
Writing Feedback / Writing 1: The bar chart shows mobile usage in a country by age group from 1998 to 2000. [3]
The given bar graph illustrates the proportion of citizens utilizing mobile in a nation by distinct age brackets between 1998 and 2000
Overall, the rate of mobile usage in the 16 to 50 years old was highest while that of people less than 15 was lowest during this given time. It is noticeable there was an increase in the proportion of mobile usage less than 15 and more than 50, but the opposite was true for remaining age groups.
In 1998, 53% of mobile users were aged 16 to 30, which held the leading position. Meanwhile, the percentage of citizens utilizing mobile in the 31 to 50 age bracket was 36% higher than that of people over 50, at 4%. Followed by 2% of mobile users less than 15, standing at the lowest position.
From that time onwards, while this number of mobile users less than 15 and from 16 to 30 years old stayed unchanged, the proportion of mobile usage in the 31 to 50 aged bracket underwent a slight decline of 37% in 2000. In addition, a minimal growth was recorded in the inhabitants more than 50 years old in 2000.
mobile users by age
The given bar graph illustrates the proportion of citizens utilizing mobile in a nation by distinct age brackets between 1998 and 2000
Overall, the rate of mobile usage in the 16 to 50 years old was highest while that of people less than 15 was lowest during this given time. It is noticeable there was an increase in the proportion of mobile usage less than 15 and more than 50, but the opposite was true for remaining age groups.
In 1998, 53% of mobile users were aged 16 to 30, which held the leading position. Meanwhile, the percentage of citizens utilizing mobile in the 31 to 50 age bracket was 36% higher than that of people over 50, at 4%. Followed by 2% of mobile users less than 15, standing at the lowest position.
From that time onwards, while this number of mobile users less than 15 and from 16 to 30 years old stayed unchanged, the proportion of mobile usage in the 31 to 50 aged bracket underwent a slight decline of 37% in 2000. In addition, a minimal growth was recorded in the inhabitants more than 50 years old in 2000.

Screenshot2022111.png
