nhomnhi
Dec 15, 2022
Writing Feedback / The consumption of fish - Writing task 1 ; line graph [5]
topic :
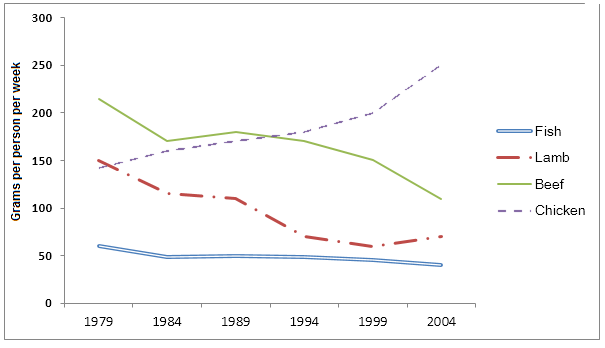
The graph below shows the consumption of fish and some different kinds of meat in a European country between 1979 and 2004.
The line graph give information about the consumption of fish and 3 kinds of meat ( beef , lamb ,chicken ) in a European country from 1979 to 2004.
Overall , at the start of period beef had a most consumption, which was replaced by chicken from around 1984 to 2004 . Fish had lowest consumption and remained no change
With regards to the amount of beef use , it began around 230 in 1979 , decreased to 180 in the middle of 1979 and 1984 , and suprisingly reached a peak at 230. After 1984 , the use of beef decreased to around 120 in the final. in contrast to chicken , it began around 145 and then increased fast , it was around 240 in 2004.
Lamb started at 150 and then peaked at 130 in 1989 .Since that year it decreased and in 2004 it was around 80. Fish was not popular used in Europen country , during 25-year period started from 1979 , fish did not changed much , it was around 50.
topic :
The graph below shows the consumption of fish and some different kinds of meat in a European country between 1979 and 2004.
fISH, LAMB, BEEF AND CHICKEN CONSUMPTION
The line graph give information about the consumption of fish and 3 kinds of meat ( beef , lamb ,chicken ) in a European country from 1979 to 2004.
Overall , at the start of period beef had a most consumption, which was replaced by chicken from around 1984 to 2004 . Fish had lowest consumption and remained no change
With regards to the amount of beef use , it began around 230 in 1979 , decreased to 180 in the middle of 1979 and 1984 , and suprisingly reached a peak at 230. After 1984 , the use of beef decreased to around 120 in the final. in contrast to chicken , it began around 145 and then increased fast , it was around 240 in 2004.
Lamb started at 150 and then peaked at 130 in 1989 .Since that year it decreased and in 2004 it was around 80. Fish was not popular used in Europen country , during 25-year period started from 1979 , fish did not changed much , it was around 50.

consumptionfishmea.png
