vaananh
Oct 28, 2023
Writing Feedback / IELTS Writing task 1 - pie charts present the expenditure of senior students in 3 high schools [2]
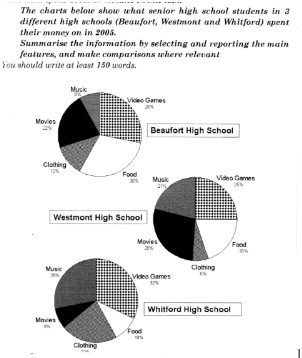
The chart shows the expenditure of senior students in 3 high schools on 5 different categories in 2005.
Overall, it is clear that the percentage of money spent on entertainment accounts for the majority while the expense of money spent on clothing and food was minor.
Regarding entertainment accounts, one quarter of the percentage of money spent on video games by Beaufort and Westmont students. Whitford's students spent 4% more than Beaufort's students, at 32% and 28% respectively. Roughly one quarter of money was spent on music in Westmont and Whitford compared to only 8% was spent on this category in Beaufort. Watching movies is also a popular activity in Beaufort and Westmont, at 22% and 28% respectively. In contrast, Whitford's students spent only 8% of their total spending on this category.
The majority of money was spent on food in Beaufort and Westmont, at 30% and 20% respectively whilst only 10% spent on this category in Whitford high school. Whitford's students spent approximately a quarter of their spending on clothing. Only 12% spent on clothing by Beaufort's students which doubled the figure for Westmont's students.
summarise the information from the graph
The chart shows the expenditure of senior students in 3 high schools on 5 different categories in 2005.
Overall, it is clear that the percentage of money spent on entertainment accounts for the majority while the expense of money spent on clothing and food was minor.
Regarding entertainment accounts, one quarter of the percentage of money spent on video games by Beaufort and Westmont students. Whitford's students spent 4% more than Beaufort's students, at 32% and 28% respectively. Roughly one quarter of money was spent on music in Westmont and Whitford compared to only 8% was spent on this category in Beaufort. Watching movies is also a popular activity in Beaufort and Westmont, at 22% and 28% respectively. In contrast, Whitford's students spent only 8% of their total spending on this category.
The majority of money was spent on food in Beaufort and Westmont, at 30% and 20% respectively whilst only 10% spent on this category in Whitford high school. Whitford's students spent approximately a quarter of their spending on clothing. Only 12% spent on clothing by Beaufort's students which doubled the figure for Westmont's students.

Screenshot2023102.png
