vothanhan27
Nov 30, 2023
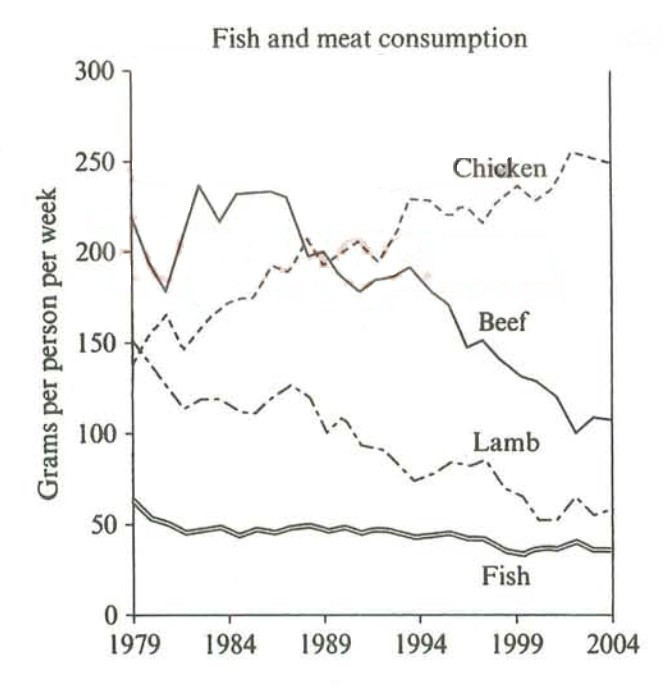
Writing Feedback / The line chart illustrate fish and meat consumption (grams) in HCM city from 1979 to 2004-WRITING 1 [2]
the line graph gives information about how many grams of fish and meat were consumed in a week by one person in HCM city over the period of 25 years starting from 1979.
Overall, it is obvious that the number of fish was the lowest for all years during the described period. In addition, there was a slight volatility in the rest.
Regarding beef and chicken, initially, over 200 grams of an individual ate beef, which was slightly higher than that of Chicken, at roughly 60 grams. However, the data for Chicken eventually surpassed the figure for beef, and it was chosen to occupy the first food from 1989 to 2004. Additionally, the figure for beef dwindled by approximately 100 grams at the end of the period and it reached the position the second meat consumption.
When it comes to the other two foods, both the number of Fish and Lamb were lower compared to two data of Chicken and Beef. Starting, 150 grams of Lamb was higher than the figure for Chicken and after that, it gradually decreased to nearly 50 grams. The number of Fish chosen always fluctuated by approximately 50 grams and it was the lowest over the period.

The line chart illustrate fish and meat consumption (grams) in HCM city from 1979 to 2004-WRITING 1
