Mai_ndh
Dec 22, 2023
Writing Feedback / IETLS Writing_Task 1_Line Graph_Moviegoers [2]
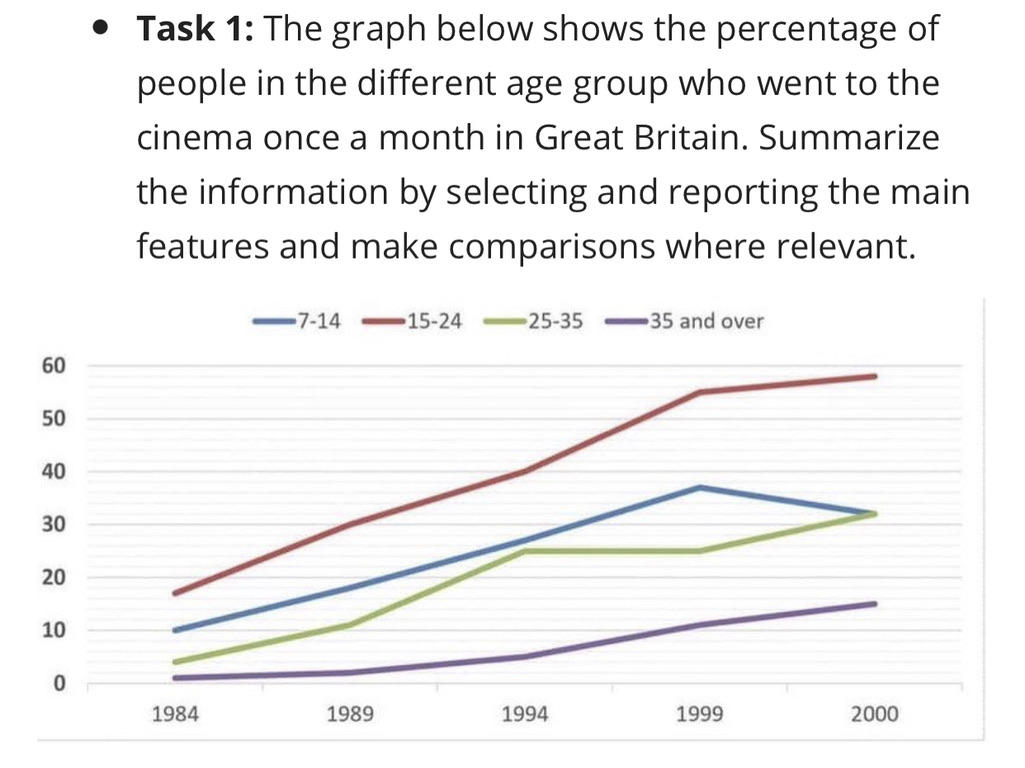
The line graph illustrates the proportion of people in various groups of age going to the cinema once every month in Great Britain from 1984 to 2000.
Overall, there were general increases in the percentages of citizens in 4 groups of 7-14 years old, 15-24 years old, 25-35 years old, and 35 and over. In addition, the brackets of 15-24 and 35 and over consistently had the highest and lowest figures throughout the period respectively.
The share of moviegoers from 15 to 24 started at about 18%, after which it saw a progressive rise to a peak of roughly 59% in 2000. Similarly, although the figure for adults enjoying movies in the cinema at the age of 35 and above almost stayed unchanged in the first 5 years at north of 1%, it steadily grew to around 15% at the end of the period examined.
10% of children and teenagers from 7 to 14 years old watched films in movie theaters, followed by considerable growth and a final decline from 38% in 1999 to about 31% one year later. In the meantime, the figure for 25-35 bracket of age rose significantly from 3.5% to exactly 25% in the first 10 years and maintained at this level until 1999 before keeping climbing to 31% at the same level of that of 7-14-year-olds in 2000.

2E10538D76FE4C10B.jpeg
