rubie
Jun 17, 2024
Writing Feedback / IELTS Task 1 demand for electricity and how electricity is used. [2]
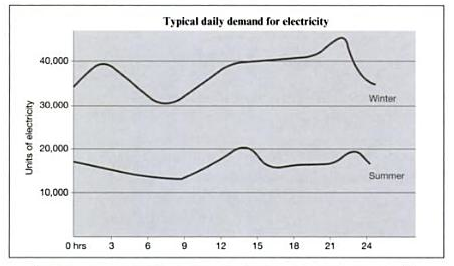
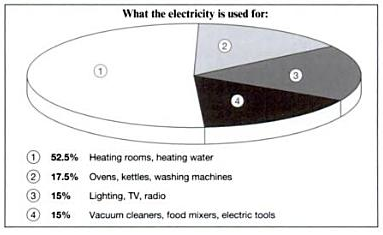
The line graph compares the average demand for electricity on a daily basis during summer and winter while the pie chart compares the sources of electricity usage among the households.
It is clear that winter has a significantly higher demand for electricity when compared with summer. Additionally, heating activities including heating the rooms and water takes up the largest proportion of the sources of usage. The level is followed by the typical activities in the kitchen, ranging from baking in ovens, boiling water in kettles and doing laundry work in washing machines. While the percentage of electricity spent in the category of lighting, TV and radio is the same with that of vacuum cleaners, food mixers and electric tools.
Looking into details, the average demand of electricity during winter fluctuates between 30000 units to 45000 units which is nearly double of that during summer which fluctuates between 10000 units to 20000 units. The majority of the electricity is spent in heating activities that accounts for half of the total spending among various household activities.

source of photo: https://www.ielts-simon.com/.a/6a0120a5bb05d8970c0120a8624a2c970b-pi
source of photo: https://www.ielts-simon.com/.a/6a0120a5bb05d8970c0120a88ebdd0970b-pi
