dung_284
Jun 21, 2024
Writing Feedback / Essay about ownership of electrical appliances and amount of time spent doing housework [2]
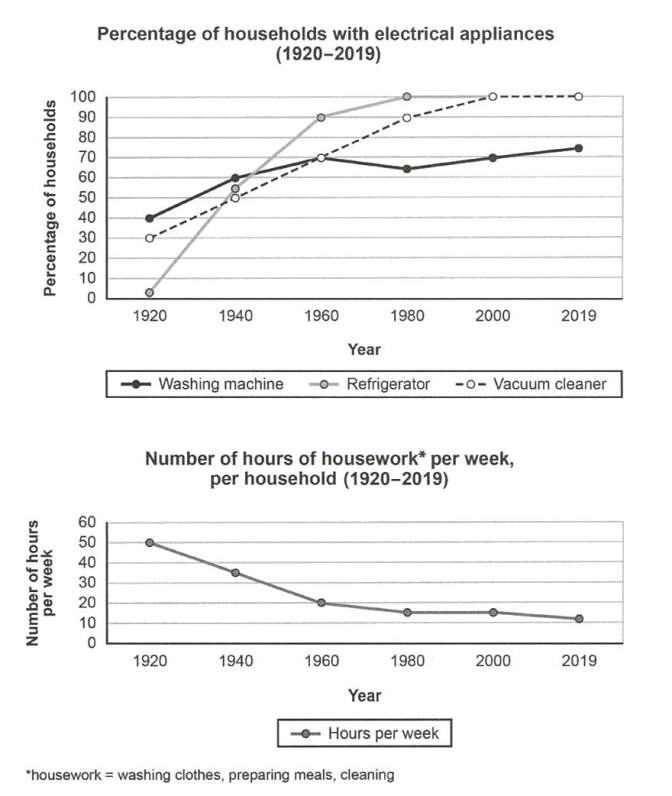
The first given line graph delineates the percentage of households owning three distinct electrical appliances - washing machine , refrigerator and vacuum cleaner - in a country , whereas the second illustrates how many hours households spent on housework over a decades , commencing in 1920.
In overview , the presences of the three electrical appliances in households showed an upward trend, while the amount of time was allocated for housework declined throughout the timeframe. Notably , the percentage of households owning washing machine dominated at first , but then was surpassed by its counterparts.
The percentage of households with washing machine started at 40% , witnessing a noticeable climb to 60% and dominating the prevalance of electrical appliances in the first 20 years. Thereafter , the figure has risen with a more moderate pace and peaked at over 70% , howerver , surpassed by the two afformentioned appliances within the remaining timeline. The latter two appliances saw divergent trend , there seemed to be no households with refrigerator at first , yet , observed a dramatic escalation , reaching 100% after 6 decades ,while of vacuum cleaner showed a quite similar tendency when started at 30% and then rocketed to 100% in 2000 .
Regarding weekly hours spent by households on housework , the figure started at 50 hours per week , nevertheless , dropped dramatically to 20 hours per her week after the rapid increase of electrical appliances in houses.Afterwards , the figure still continued to decline gradually to around 10 hours per week by the end of the period.

1313.png
