thu153
Aug 14, 2024
Writing Feedback / The graph below gives information about U.S. government spending on research between 1980 and 2008. [2]
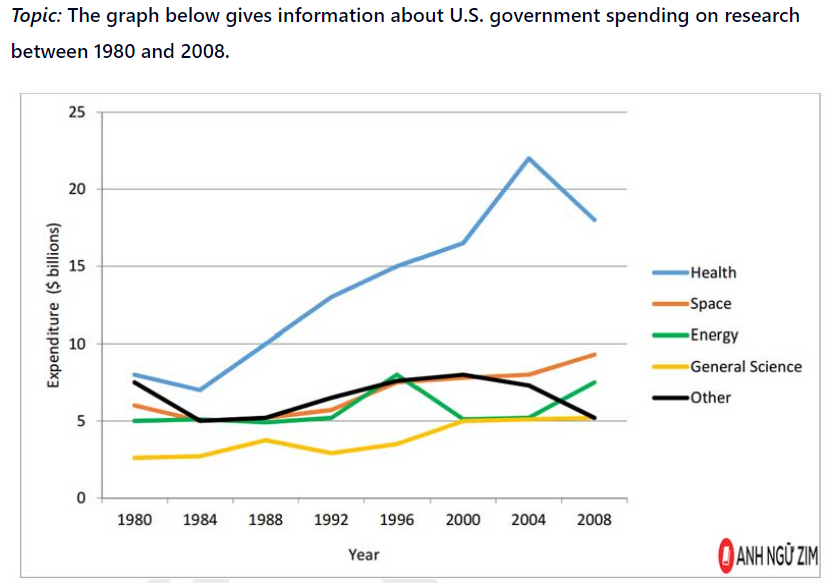
The line graph illustrates the amount of money US government expenditures on research in five fields (Health, Space, Energy, General Science and Other) from 1980 to 2008. Overall, there was an upward trend in all four kinds of research: Health, Space, Energy and General Science over the period of 28 years. While, the figure for Other decreased slightly between 1980 to 2008. In addition, it can be seen that US government spent the most money on Health research.
Starting at around $8 billion, the number of expenditures government spent on Health dropped slightly in 1984 before rising dramatically over the next four years and reached a peak at around $23 billion in 2004. After that, this figure witnessed a decrease in 2008. In contrast, the fund that government spent on General Science was the lowest over the period. A fluctuation was seen over 20 years before remaining unchanged at $5 billion from 2000 to 2008.
In 1984, the amount of money the government spent on three kinds of research: Space, Energy and Other was the same, at $5 billion. After this year, there was a climb in the number of expenditures in both research Space and Energy, at $9 billion and $7 billion respectively. The opposite was true for the figure for Other, it can be seen a slight growth from 1984 to 2000 before returning back same value in 1984.

Screenshot2024081.png
