ding
Oct 10, 2012
Writing Feedback / IELTS: World literacy rates by region and by gender; 'lower for men than women' [2]
Please review my report. Your comments are very valuable to me.
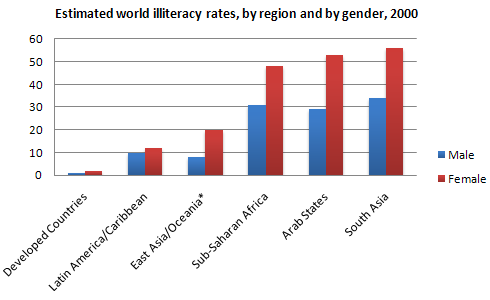
The chart below shows estimated world literacy rates by region and by gender for the year 2000.
Write a report for a university lecturer describing the information below.
You should write at least 150 words.
My answer:
The bar chart compares the proportions of male and female who cannot read and write in five areas in the world, namely developed countries, Latin America/Caribbean, East Asia/Oceania, Sub-Saharan Africa, Arab States, and South Asia.
It is clear that the illiteracy rates are lower for men than women, and they are the highest among people from South Asia.
Lack of literacy skills are rarely found in developed countries as the numbers of either men or women are approximately equal to zero. In contrast to this, there are 10 per cent of men who are unable to read and write, and this number is even a little bit higher for women in Latin America/Caribbean. While East Asia/Oceania has the approximation of the illiteracy rate for male with America/Caribbean, its rates for female are almost double, at 20 per cent.
The three remained areas, including Sub-Saharan Africa, Arab States, and South Asia, have relatively high numbers of illiterate people. The average percentages of illiteracy rates for men and women are 30 per cent and 50 per cent respectively.
(176 words)

figure


