gandora1510
Oct 23, 2012
Writing Feedback / [ielts task 1] report on quantities of goods transported in UK [2]
Please help me to correct this report. Many thanks from bottom of my heart :)
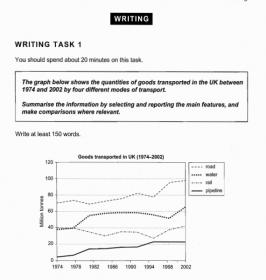
The line graph compares the quantities of goods transported by four different transportation means in the UK from 1974 to 2002.
Generally speaking, the amount of goods transported by road, water and pipeline increased markedly over the period shown, whereas there was an insignificant rise in that transported by rail.
Approximate 70 million tonnes of goods were transported by road in the UK and this figure went up to nearly 100 million in 2002, remained as the largest quantity transported. The quantity of goods transported by water, started at the third place, overtook the second by rail in 1978 and stayed at this position till the last time reported (2002).
The amount of goods transported by rail was 40 million tonnes in 1974. It decreased gradually during 10 subsequent years and had a plateau for a decade before rising steadily to over 40 million in 2002. Of the equal note is that the amount of goods transported by pipeline reached a peak in 1994 after constantly increasing throughout 20 years. Between 1994 and 2002, this number leveled off.

Capture.jpg
