HA254
Aug 15, 2013
Writing Feedback / IELTS writing task 1 - line graph on usage of cars in the UK [3]
Please give me some feedback and grade it if you can. I have attached the line graph with this post.
Thank you very much.
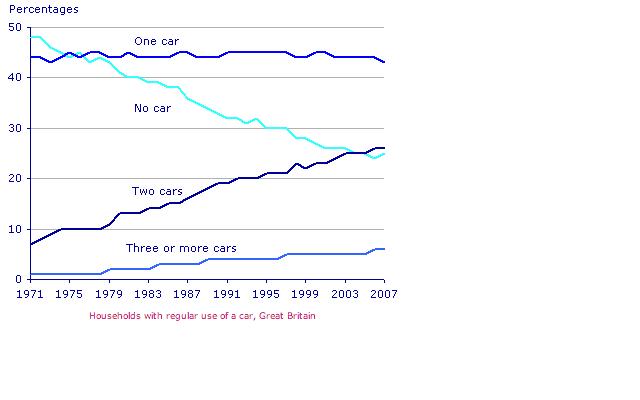
The graph below gives information about car ownership in Britain from 1971 to 2007.
The line graph demonstrates trends in car ownership in Britain during the period of 36 years.
Overall, the car ownership in Britain has gradually increased since 1971. Specifically, the number of households with two cars increased, while the number of households with no car declined.
In 1971, there's a high percent of households with no car (about 48%). The figures for households with one, two and three or more cars are lower, at about 43%, 8% and 1% respectively. However, households with two cars gradually rose over the next 30 years, reaching 26%. Similarly, households with three or more cars rose 6% over the next 30 years. By contrast, households with one car steadily remained between 42% to 43%.
The most dramatically change was seen in the proportion of households with no car, it dropped from 48% to around 25% by 2007. By 2007, households with one car have the highest proportion (almost half of the population); compared to two and three or more cars, 26% and 7% respectively.This shows that by 2007, it is common that households own cars whereas back in 1970s, it was very uncommon.

graph.jpg
