Writing Feedback /
IELTS - Line graph (UNEMPLOYMENT RATES OF PEOPLE IN THE US AND JAPAN) [3]
Please comment on the report and give a band if you can. I have attached the graph with this post
Thank you very much :)
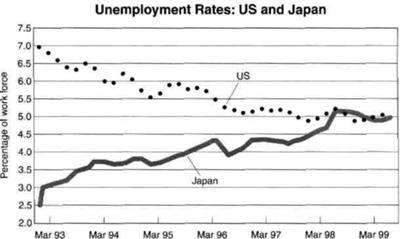
The line graph illustrates the percentage of unemployment in the US and Japan from March 1993 to March 1999.
Generally speaking, although the unemployment rates in two countries fluctuated for all the period, the figure of the US showed a downward trend while Japan's showed an upward trend.
For example, after a gradual decrease from the highest point of 7.0 percent to about 5.5 percent for the first three years, the percentage of unemployment in the US continued fall slightly to the lowest point of around 5.0 percent in the last years. By comparison, the percentage of workforce in Japan rose quickly from 2.5 percent in March 1993 to 4,4 percent in March 1996, followed by a peak of 5.5 percent in 1998 and it experienced fluctuations between 5.0 percent and 5.5 percent for the last year.
An interesting note is that only in March 1999 did the workforce rates in the US and Japan have a proximate figure around 5.0 percent.

task1linegraphun.jpg

