Writing Feedback /
IELTS: How British people spending their money on fast foods? Chart [5]
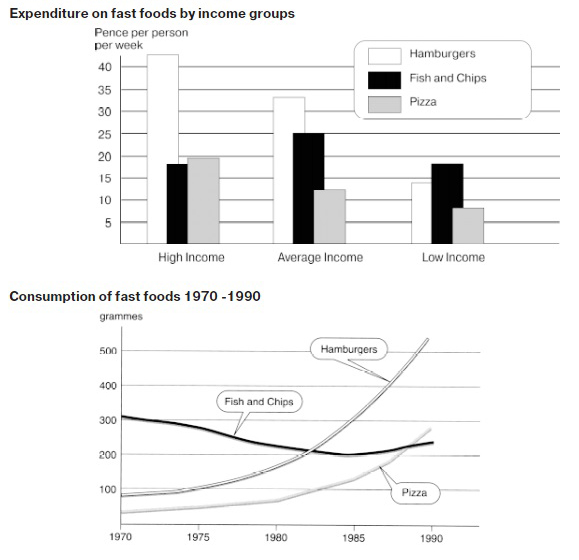
The chart below show the amount of money per weeks spent on fast foods in Britain. The graph shows the trends in consumption of fast foods.
Write a report for a university lecturer describing the information shown below.(at least 150 words)The chart indicates the average expenditure on fast foods related to income groups. Three fast foods are selected in the research: hamburgers, fish and chips, and pizza. The graph describes the amount of consumption fast foods varying from 1970 to 1990.
Frist, people with high income is revealed to consume their money to fast foods more. In particular, they tends to eat hamburgers most frequently. People with average income also spend money to buy hamburgers, however, low income people spend money in fish and chips.
As you have seen, hamburgers are the most popular fast foods in Britain. However, in 1970, fish and chips were popular than the other fast foods. Consumptions of Hamburgers and pizza were both under 100 grammes per week. But the consumptions raised highly, and in 1990, 500 and 300 grammes of hamburgers and pizza are consumed, respectively. Meanwhile, consumption of fish and chips have decreased until 1970, and now it is the lowest consumed fast food of the three fast foods.

