Fenny Nelwan
Nov 18, 2015
Writing Feedback / The pie chart informs what is interesting for Australian citizens and for new migrants - IELTS 1 [2]
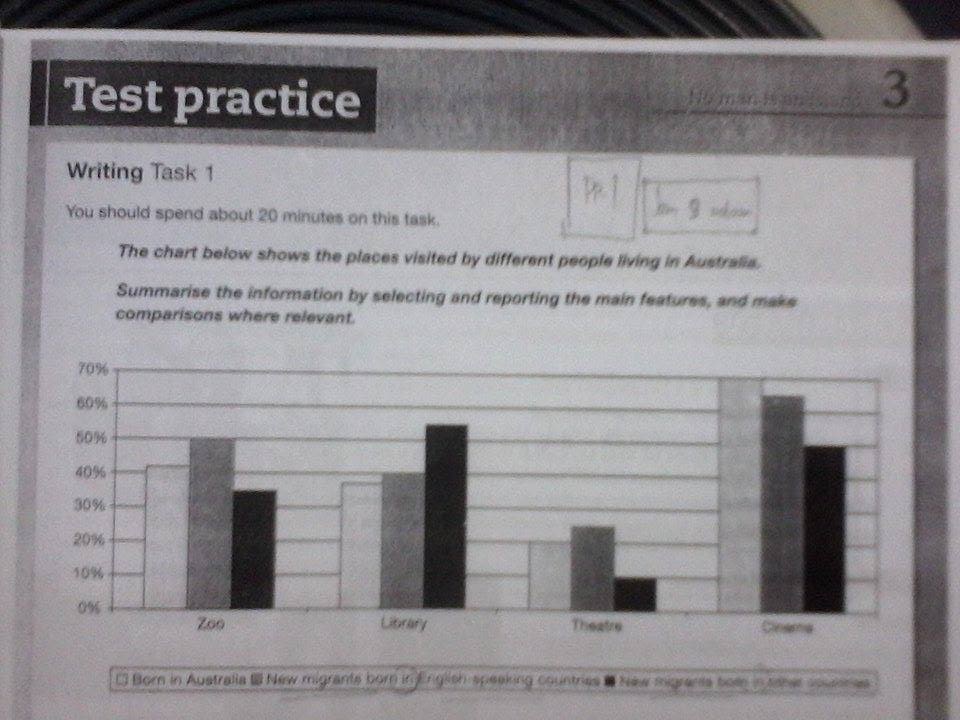
A comparisonof percentage of people who come to 4 different places by different people in Australia is presented in pie chart. Overall, there show the most popular to visited by people in New migrants born in other countries than the 3 other places. While, the people born in Australia and New migrants born in English - Speaking countries experiences the most interesting place to visit is Cinema.
The percentage of visitor has growing up at around more than half percent in New migrants born in other countries in library while, the other places to become less choice, approximately more than a third percent of visitors.
On the other hand, there shows a top percentages at over three - fifhts and seven in ten visitor in cinema in people born in Australia and new migrants born in English - Speaking countries, respectively. Although, the most people born in Australia choices cinema which is the leading position of visitors.

12273161_10203634476.jpg
