How to describe graphs in an oral presentation?
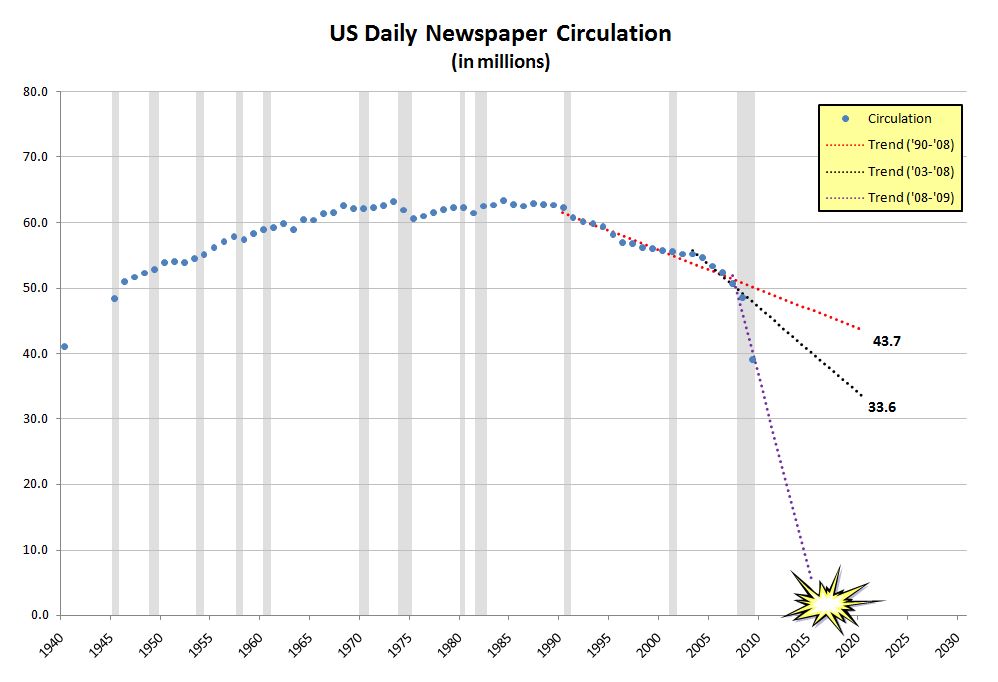
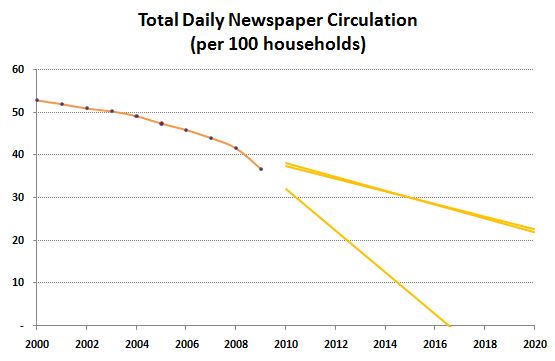
I will give a 5-minite oral presentation the day after tomorrow, my topic is "The current situation of the newspaper industry" and I am supposed to describe the graphs below and simply analyse them in the presentation.(But the main part is the describtion).
I am really confused of describing them...Could you give me an example?I will really appreciate it if you can help me.Thank you! :)

.jpg

NewsCirc__Total_w_P.jpg
Start by saying something about one of the charts:
Chart number one shows the amount of American newspapers that were circulated in the years between 1940 and 2010, and it also shows projected newspaper circulation for the years between 2010 and 2025.
Now it's your turn. Say something else about chart number one. This tests your ability to look at the chart and make observations. What can you observe?
Then, do the same for the next chart.
Finally, think about both charts together than make an observation about what you notice when you consider them in relation to one another.
I hope that helps!!
talk about major/insignificant increases and decreases over time. how this increased over the course of 3 years or whatever its about.
ⓘ Need academic writing help? 100% custom and human!


