Lynapharma
Apr 7, 2017
Writing Feedback / IELTS - Task 1 - movie theater attendance by age group in Great Britain [3]
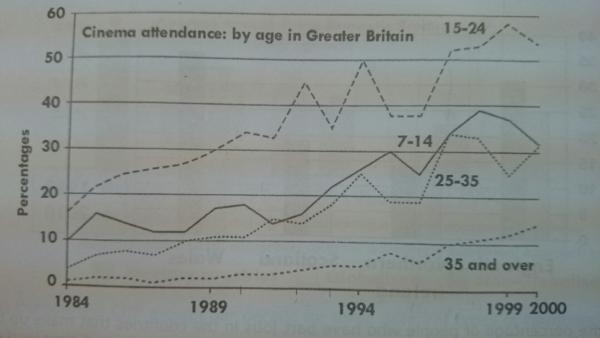
The line graph given compares four age groups of people (7-14, 15-24, 25-35 and over 35 years old) in terms of going to movie theater in Great Britain from 1984 to 2000. Overall, there was a general increase in all four groups over the 16-year period, despite some fluctuations. The figure of 15 to 24 years old group remained the highest in the most years while the porportion of aldults over 35 years old accounted the smallest.
In 1984, the number of teenagers from 15 to 24 attended cinema activities stood at approximately 16% and then this number rose up to around 32% in 1990s. Before reaching the peak of nearly 60% in 1999, there was dramatical fluctuations from 1990 to 1996, still below 50%. With the same trend, the porportion of chidlren from 7 to 14 years old underwent certain flutuations over the samilar period before 1990s and got the highest point over the whole line graph with almost 40% in 1998 and then dropped down to below 30%.
It can be seen from the graph that the figure of young aldults in 25-35 years old group varied less significant than two above groups. This figure stood at around 5% in 1984 and with some slight fluctuations and finally increased to below 30%. In contrast, the proportion of people over 35 years old increased steadily throughout the period of 16 years old form about 3% to 14% in 2000.
cinema visitors in great britain
The line graph given compares four age groups of people (7-14, 15-24, 25-35 and over 35 years old) in terms of going to movie theater in Great Britain from 1984 to 2000. Overall, there was a general increase in all four groups over the 16-year period, despite some fluctuations. The figure of 15 to 24 years old group remained the highest in the most years while the porportion of aldults over 35 years old accounted the smallest.
In 1984, the number of teenagers from 15 to 24 attended cinema activities stood at approximately 16% and then this number rose up to around 32% in 1990s. Before reaching the peak of nearly 60% in 1999, there was dramatical fluctuations from 1990 to 1996, still below 50%. With the same trend, the porportion of chidlren from 7 to 14 years old underwent certain flutuations over the samilar period before 1990s and got the highest point over the whole line graph with almost 40% in 1998 and then dropped down to below 30%.
It can be seen from the graph that the figure of young aldults in 25-35 years old group varied less significant than two above groups. This figure stood at around 5% in 1984 and with some slight fluctuations and finally increased to below 30%. In contrast, the proportion of people over 35 years old increased steadily throughout the period of 16 years old form about 3% to 14% in 2000.

cinema_attendance_by.jpg
