carol326
Dec 12, 2017
Writing Feedback / The general picture and percentage about weight of residents who live in Charlestown in 1955 & 2015 [3]
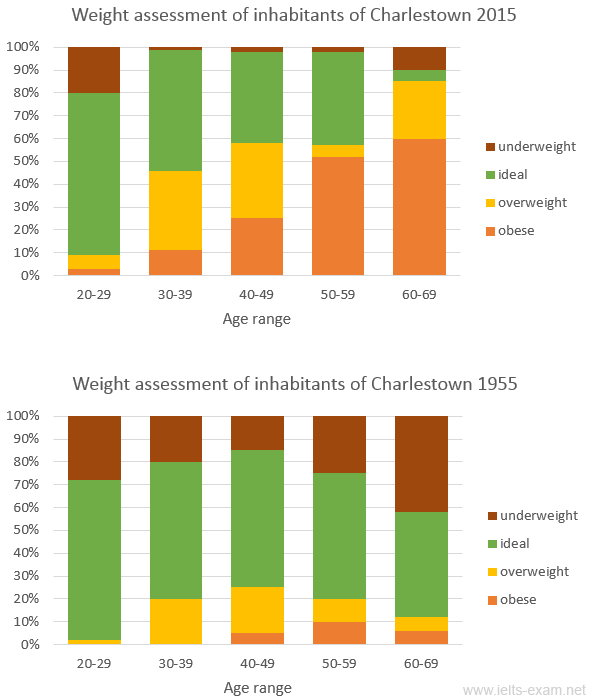
The charts have provide the general picture and percentage about weight of residents who live in Charlestown in 1955 and 2015.
The percentage of ideal was the most popular weight in 1955.Only those aged 40-49, 50-59 and 60-69 had a few percentage of obesity.There were a shape increasing of overweight and obesity, especially those aged 60-69.
There were a huge percentage of ideal in different age groups in 1955.Those aged 20-29 were the healthiest one.There were only the percentage of underweight, ideal and overweight which were around 30%, 65% and 5% respectively.
There were an increase of obesity among different age groups in 2015.Those aged 60-69 had the most serious obesity problem. The percentage of obesity among 60-69 age was 60%, but the percentage of ideal was around 5%.
IELTS Writing task 1 practice
The charts have provide the general picture and percentage about weight of residents who live in Charlestown in 1955 and 2015.
The percentage of ideal was the most popular weight in 1955.Only those aged 40-49, 50-59 and 60-69 had a few percentage of obesity.There were a shape increasing of overweight and obesity, especially those aged 60-69.
There were a huge percentage of ideal in different age groups in 1955.Those aged 20-29 were the healthiest one.There were only the percentage of underweight, ideal and overweight which were around 30%, 65% and 5% respectively.
There were an increase of obesity among different age groups in 2015.Those aged 60-69 had the most serious obesity problem. The percentage of obesity among 60-69 age was 60%, but the percentage of ideal was around 5%.

IELTS_Writing_Task_1.png
