joeychk
Jun 4, 2018
Writing Feedback / IELTS Writing Task 1- chart of frequency of eating at fast food restaurants [2]
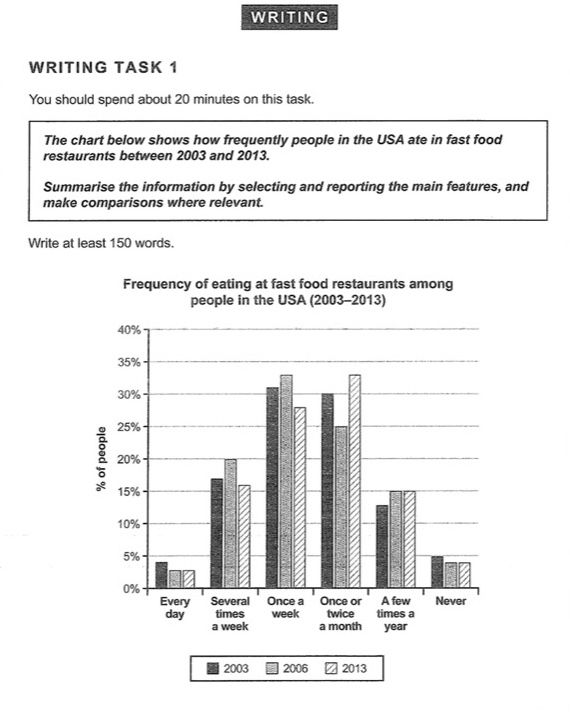
The chart presents the proportion of frequency of American eating at fast food restaurant in 2003, 2006 and 2013.
It is obvious that the data are defined in three groups. Most people pretend to eat fast food once a week or once or twice a month. In contrast, the options of 'Every day' and 'Never' have the lowest ratio. Camp are to the highest and lowest, others are in theirs average.
Differ form other trends, the choices of 'once or twice a month' in 2013 surpassed the data in 2003 and 2006, which is around 32 per cent. This was the only time that the data in 2013 has higher than the 2003 and 2006.
In 2006 and 2013, the options of 'every day', 'A few times a year' and 'never' have an identical porprotion, which were around 2.5, 15 and 4 per cent respectively. Other options have a clear distance between the different period of percentage.
fast food consumption in the usa
The chart presents the proportion of frequency of American eating at fast food restaurant in 2003, 2006 and 2013.
It is obvious that the data are defined in three groups. Most people pretend to eat fast food once a week or once or twice a month. In contrast, the options of 'Every day' and 'Never' have the lowest ratio. Camp are to the highest and lowest, others are in theirs average.
Differ form other trends, the choices of 'once or twice a month' in 2013 surpassed the data in 2003 and 2006, which is around 32 per cent. This was the only time that the data in 2013 has higher than the 2003 and 2006.
In 2006 and 2013, the options of 'every day', 'A few times a year' and 'never' have an identical porprotion, which were around 2.5, 15 and 4 per cent respectively. Other options have a clear distance between the different period of percentage.

774EA0C00B1D495F8.jpeg
