DuongYen
Jul 12, 2018
Writing Feedback / The line graph illustrates how many crime-related incidents occurred in the inner Newport city [3]
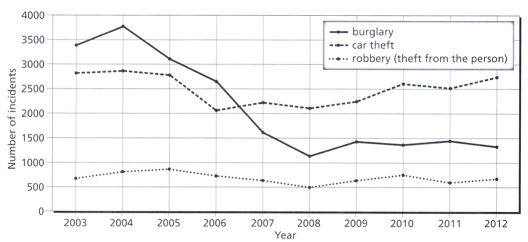
The line graph illustrates how many crime-related incidents is occurred in the inner Newport city over the course of 10 years starting in 2003. 3 categories of crime, namely burglary, car theft and robbery.
Looking at the chart, it is immediately obvious that, from 2003 to 2012, the amount of robbery and car theft cases experience a remain relatively unchanged trends, with the exception of a downward trend in burglary rate.
The robbery was not a popular crime in Newport city center during the period of 2003 to 2012, due to the number was fluctuated between 500 to 1000 cases in those years. With the same movement, the rate of car theft crimes was recorded in keeping to change under 3000 and hit a low at 2000 incidents in 2006.
The number of burglary incidents saw a decreasing by more than 2 times in the 10-year period from 2003. The crime stood at nearly 3500 burglary cases in 2003 before reached a peak at around 3750 cases in 1 year later.
The changing rates of crime in the inner city from 2003 to 2012
The line graph illustrates how many crime-related incidents is occurred in the inner Newport city over the course of 10 years starting in 2003. 3 categories of crime, namely burglary, car theft and robbery.
Looking at the chart, it is immediately obvious that, from 2003 to 2012, the amount of robbery and car theft cases experience a remain relatively unchanged trends, with the exception of a downward trend in burglary rate.
The robbery was not a popular crime in Newport city center during the period of 2003 to 2012, due to the number was fluctuated between 500 to 1000 cases in those years. With the same movement, the rate of car theft crimes was recorded in keeping to change under 3000 and hit a low at 2000 incidents in 2006.
The number of burglary incidents saw a decreasing by more than 2 times in the 10-year period from 2003. The crime stood at nearly 3500 burglary cases in 2003 before reached a peak at around 3750 cases in 1 year later.

The chart below shows the changes that took place in three different areas of crime in Newport City
