phamkhatu
Aug 17, 2018
Writing Feedback / Write a report for a university lecturer describing the information in the graph below [3]
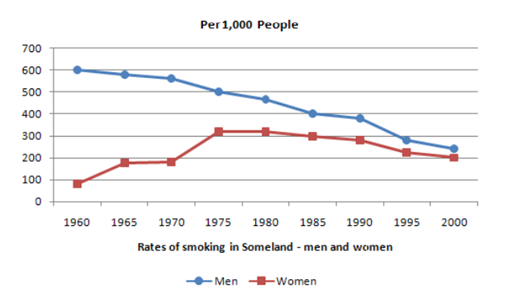
The given line graph illustrates reveals the rates of smoking in Someland between men and woman over the course of 40 years starting from the 1960s
As can be seem from the graph, It is clearly evident that both men and women in the rates of smoking in Someland witnessed and a downward trend over the time frame
In 1960, The rates of smoking in Someland registered the highest among the two, standing at 600 men, this rates decreased to about 550 men fifteen years later and then continued plunged to a low in the vicinity of 400 men in 1990s the following 10 years in this graph ,meanwhile brought a sustained decline in the figure of 240 men in 2000s, A similar trend could be seen in the rates of smoking in Someland , as it stood at in the vicinity 100 women in 1960s and soaring to reach 320 women in 1975s in very 1000 smoking women and then the rates brought a sustained decline from the top 320 in 1975s to 280 during the 1990s , In the late 1990s to 2000s the century, however, plunged to a low in the figure
In conclusion, we can totally see the rate of smoking in men dropped from the beginning to the end, the rate of smoking in women increased until 1975s but then decreased for the rest of the period
rates of smoking in Someland
The given line graph illustrates reveals the rates of smoking in Someland between men and woman over the course of 40 years starting from the 1960s
As can be seem from the graph, It is clearly evident that both men and women in the rates of smoking in Someland witnessed and a downward trend over the time frame
In 1960, The rates of smoking in Someland registered the highest among the two, standing at 600 men, this rates decreased to about 550 men fifteen years later and then continued plunged to a low in the vicinity of 400 men in 1990s the following 10 years in this graph ,meanwhile brought a sustained decline in the figure of 240 men in 2000s, A similar trend could be seen in the rates of smoking in Someland , as it stood at in the vicinity 100 women in 1960s and soaring to reach 320 women in 1975s in very 1000 smoking women and then the rates brought a sustained decline from the top 320 in 1975s to 280 during the 1990s , In the late 1990s to 2000s the century, however, plunged to a low in the figure
In conclusion, we can totally see the rate of smoking in men dropped from the beginning to the end, the rate of smoking in women increased until 1975s but then decreased for the rest of the period

Write a report for a university lecturer describing the information in the graph below, please!!!!!!
