phamnguyen
Feb 11, 2019
Writing Feedback / The table illustrates the proportion of monthly household income in five countries over Europe [2]
TASK 1:You should spend about 20 minutes on this task.
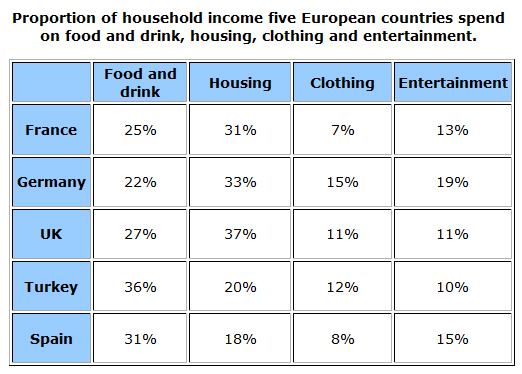
The table illustrates the proportion of monthly household income five European countries spend on food and drink, housing, clothing and entertainment.
Summarize the information by selecting and reporting the main features and make comparisons where relevant.
Write at least 150 words.
The table indicates data on the percentage of budget, which residents in five nations spend on food and drink, housing, clothing and entertainment every month. Overall, people in 5 European countries spend on food and drink and housing significantly more than remaining categories, while citizens in the UK pay the same proportion for clothing and entertainment.
Of the five countries, Spanish and Turkish households spend the highest proportions of their income for food and drink, at 31% and 36% respectively. 27% of UK households budget pay for this items, compared to 22% in Germany and 25% in France. By contrast, individuals in all of five nations spend the highest percentage for housing monthly. In France, Germany and the UK people spend more than 30% of their income for housing, at 31%, 33% and 37% respectively. However, this figure for Turkey is 20% and only 18% for Spain.
In a month, Germany is the country, which spends most in clothing and entertainment, at 15% and 19% respectively. Besides, both the UK and Turkish people pay over 10% for clothing, at 11% and 12% correspondingly, compared to only 7% by the French citizens and 8% by the Spanish citizens in the same item. The people in the UK pay the similar proportion for entertainment, at just 11%, while the figures are 15% for Spain, 13% for France and only 10% for Turkey.
IELTS WRITING TASK 1 (TABLE)
TASK 1:You should spend about 20 minutes on this task.
The table illustrates the proportion of monthly household income five European countries spend on food and drink, housing, clothing and entertainment.
Summarize the information by selecting and reporting the main features and make comparisons where relevant.
Write at least 150 words.
The table indicates data on the percentage of budget, which residents in five nations spend on food and drink, housing, clothing and entertainment every month. Overall, people in 5 European countries spend on food and drink and housing significantly more than remaining categories, while citizens in the UK pay the same proportion for clothing and entertainment.
Of the five countries, Spanish and Turkish households spend the highest proportions of their income for food and drink, at 31% and 36% respectively. 27% of UK households budget pay for this items, compared to 22% in Germany and 25% in France. By contrast, individuals in all of five nations spend the highest percentage for housing monthly. In France, Germany and the UK people spend more than 30% of their income for housing, at 31%, 33% and 37% respectively. However, this figure for Turkey is 20% and only 18% for Spain.
In a month, Germany is the country, which spends most in clothing and entertainment, at 15% and 19% respectively. Besides, both the UK and Turkish people pay over 10% for clothing, at 11% and 12% correspondingly, compared to only 7% by the French citizens and 8% by the Spanish citizens in the same item. The people in the UK pay the similar proportion for entertainment, at just 11%, while the figures are 15% for Spain, 13% for France and only 10% for Turkey.

TASK1.jpg