Nguyen Cuong
Mar 30, 2019
Writing Feedback / IELTS: Graph - the amount of fast food consumed by juveniles in Australia [4]
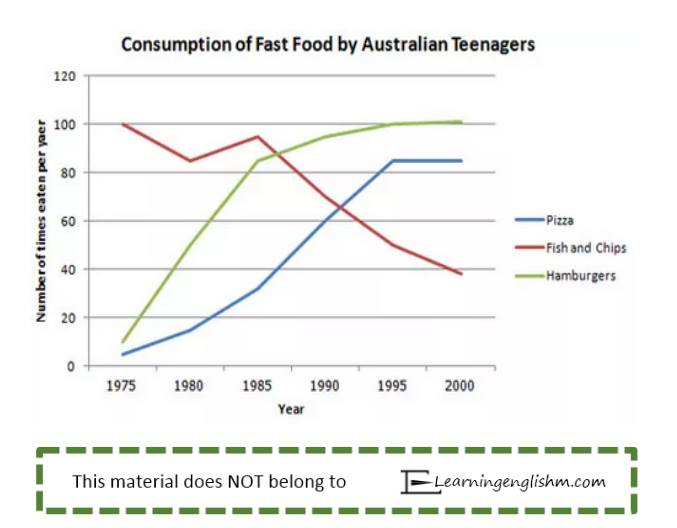
The graph illustrates the expenditure of junk-food using by Australian teenagers over period 25-years
It is clear that the amount of food changed slightly.While the number of hamburgers ,fish and chips increased significantly,the consumption pizza decreased steadily from 1975 to 2000
In 1975,the amount of pizza was consumed by teenager at about 5 times.Additionally, the figure of hamburgers at about 10 times.while about 100 times the pizza-food was eaten by Australia middle-people.
By 2000, the expenditure of pizza rose dramatically at about 85 times. Additionally, the number of times Australian young-people eating hamburgers increased considerably at about 103 times and reached highest number over research period.By contrast, the consumption of fish and chips decreased substantially at about 39 times over 25 years
Consumption of fast food by Australian teenagers
The graph illustrates the expenditure of junk-food using by Australian teenagers over period 25-years
It is clear that the amount of food changed slightly.While the number of hamburgers ,fish and chips increased significantly,the consumption pizza decreased steadily from 1975 to 2000
In 1975,the amount of pizza was consumed by teenager at about 5 times.Additionally, the figure of hamburgers at about 10 times.while about 100 times the pizza-food was eaten by Australia middle-people.
By 2000, the expenditure of pizza rose dramatically at about 85 times. Additionally, the number of times Australian young-people eating hamburgers increased considerably at about 103 times and reached highest number over research period.By contrast, the consumption of fish and chips decreased substantially at about 39 times over 25 years

53196602_10213645260.jpg
