Chau Nguyen
May 19, 2019
Writing Feedback / The line graph of enquiries received by the Tourist Information Office in one city [2]
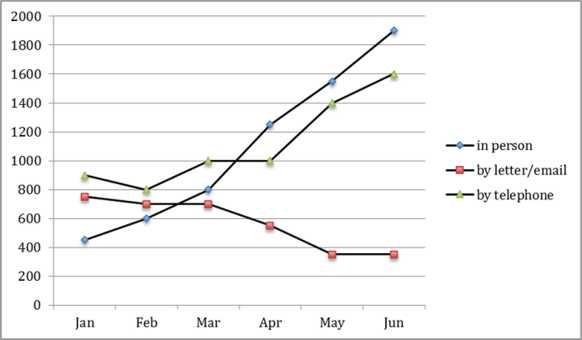
The line graph compares the quantity of requests the Tourist Informations Office in a specific city received in three different ways from January to June 2011.
It is clear that the number of in-person enquiries experienced the most dramatic change during the research period. Additionally, while the quantities of questions received in person and by telephone both rose significantly, there was a remarkable decline in the figure for letter/email.
In January 2011, the number of telephone enquiries was highest, at approximately 900, while the figure for letter/email was slightly lower, at less than 800. Meanwhile, just over 400 requests were received in person. In May, the quantity of questions collected through letter/email rapidly fell and reached the lowest point of nealy 400, whereas the other two figures gradually went up.
In June 2011, the quantity of in-person requests increased sharply to almost 1900 and became the highest figure in the line graph. Similarly, telephone's figure experienced a slow rise to about 1600. At the same time, the number of enquiries delivered through letter/email remained stable at just less than 400.
Enquiries received in one city from Jan to Jun 2011
The line graph compares the quantity of requests the Tourist Informations Office in a specific city received in three different ways from January to June 2011.
It is clear that the number of in-person enquiries experienced the most dramatic change during the research period. Additionally, while the quantities of questions received in person and by telephone both rose significantly, there was a remarkable decline in the figure for letter/email.
In January 2011, the number of telephone enquiries was highest, at approximately 900, while the figure for letter/email was slightly lower, at less than 800. Meanwhile, just over 400 requests were received in person. In May, the quantity of questions collected through letter/email rapidly fell and reached the lowest point of nealy 400, whereas the other two figures gradually went up.
In June 2011, the quantity of in-person requests increased sharply to almost 1900 and became the highest figure in the line graph. Similarly, telephone's figure experienced a slow rise to about 1600. At the same time, the number of enquiries delivered through letter/email remained stable at just less than 400.

Enquiries received in one city from Jan to Jun 2011
