MiAnnn
Jun 15, 2019
Writing Feedback / TASK 1 ( IELTS ACADEMIC ) Outokumpu companies share price - LINE GRAPH [3]
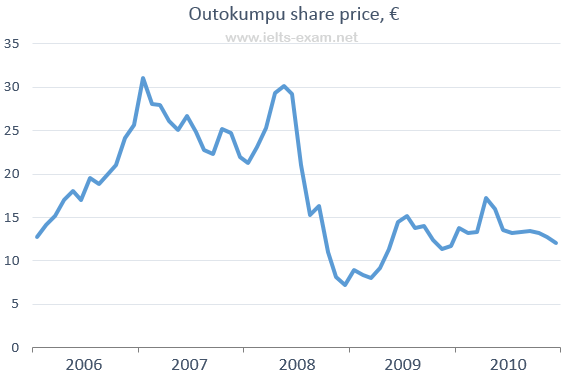
The line graph demonstrates the change of share-priced of outokumpu companies in a five-year period from january 2006 throught december 2010.
As can be seen from the graph, it is clearly evident that the pattern of share price greatly differed over the time frame.
At the beginning of the course, the share price stood at about 12.5 EUR .This figure then had some fluctuations around 17 to 20 EUR in 2006.
The year 2007 experienced a rapid climb in the share price which reached a peak of more than 30 EUR.The share price then dove dramatically by 10 EUR from 30 to 20 EUR in between 2007 and mid 2008.
In 2018 , The share price underwented a fast upward trend (around 30 EURO) .However this did not last long, the share price came down steeply to approximately 7 EUR in the beginning of 2009.During the period of 2009 and 2010,there was a violent fluctuation in the amount of price share .And finally , at the end of the period ,the price share was ,around 10 EUR.
The line graph below shows the changes in the share price of Outokumpu companies in euros between January 2006 and December 2010.
Write a report for a university lecturer describing the information below.
the change of share-priced of outokumpu companies
The line graph demonstrates the change of share-priced of outokumpu companies in a five-year period from january 2006 throught december 2010.
As can be seen from the graph, it is clearly evident that the pattern of share price greatly differed over the time frame.
At the beginning of the course, the share price stood at about 12.5 EUR .This figure then had some fluctuations around 17 to 20 EUR in 2006.
The year 2007 experienced a rapid climb in the share price which reached a peak of more than 30 EUR.The share price then dove dramatically by 10 EUR from 30 to 20 EUR in between 2007 and mid 2008.
In 2018 , The share price underwented a fast upward trend (around 30 EURO) .However this did not last long, the share price came down steeply to approximately 7 EUR in the beginning of 2009.During the period of 2009 and 2010,there was a violent fluctuation in the amount of price share .And finally , at the end of the period ,the price share was ,around 10 EUR.
The line graph below shows the changes in the share price of Outokumpu companies in euros between January 2006 and December 2010.
Write a report for a university lecturer describing the information below.

The line graph below shows the changes in the share price of Outokumpu companies in euros between Ja

