nochu307
Jun 20, 2019
Writing Feedback / The pie charts below compare 2 years in terms of online sale in retail sectors in Canada [4]
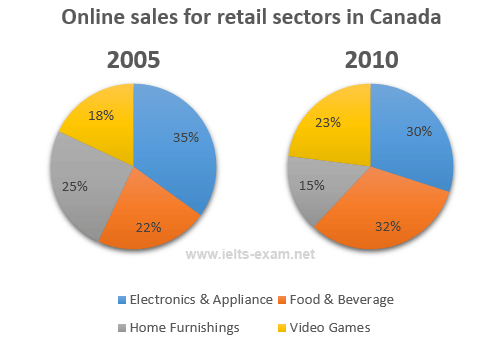
These 2 pie charts compare 2 years in terms of how many retail sectors were sold online in Canada.
General speaking, in both 2 years, together Electronics&Appilance and Food&Beverage represented more than a half of sales . The list of online sale for retail sectors weren't changed throughout the period.
It's clearly that there was a noticeable development on the sales of the Food&Beverage by 10%( from 22% to 32%) to hit the peak. Whereas, Information Technology grew up extremely quickly, giving rise to the online sales of video game, it increased steadly by 5%, reaching nearly a quarter.
By stark contrast, the number of people who bought Electronics&Appilance online decreased slightly from 35% to 30% between 2005 and 2010, a drop in 5 years, lost its top in last 5 years. Respectively, the customers of Home Funishings went down sharply, halve as many as the Food&Beverage's custuomers in the year 2010
online shopping sales for retail sectors
These 2 pie charts compare 2 years in terms of how many retail sectors were sold online in Canada.
General speaking, in both 2 years, together Electronics&Appilance and Food&Beverage represented more than a half of sales . The list of online sale for retail sectors weren't changed throughout the period.
It's clearly that there was a noticeable development on the sales of the Food&Beverage by 10%( from 22% to 32%) to hit the peak. Whereas, Information Technology grew up extremely quickly, giving rise to the online sales of video game, it increased steadly by 5%, reaching nearly a quarter.
By stark contrast, the number of people who bought Electronics&Appilance online decreased slightly from 35% to 30% between 2005 and 2010, a drop in 5 years, lost its top in last 5 years. Respectively, the customers of Home Funishings went down sharply, halve as many as the Food&Beverage's custuomers in the year 2010

IELTS_Writing_Task_1.png
