meat0509
Aug 6, 2019
Writing Feedback / The graph: million tonnes of gods transported by road, water, rail and pipeline in the given country [3]
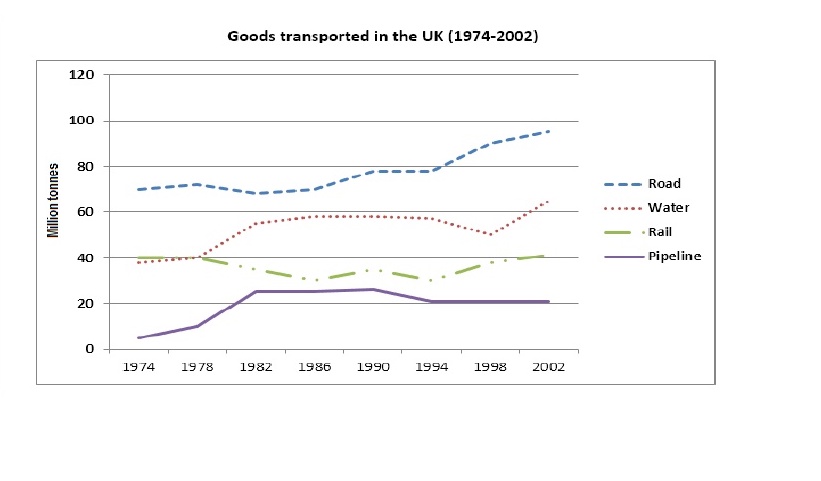
The graph below shows the quantities of goods transported in the UK between 1974 and 2002 by four different modes of transport.
The graph displays a million tonnes of transported by road, water, rail, and pipeline in the given country from 1974 to 2002.
The quantity of both road and pipeline showed an upward trend throughout this period. The amount of transported by pipeline generally climb from 5 to 20 million tonnes. Following a similar trend, despite a few drops, road transported soar to the peak of 100 million tonnes in 2002.
In contrast, the amount of transport by water and rail had the opposite trend at the beginning. Interestingly, it both starts at 40 million tonnes, but people eventually used 65 million tonnes times of water in 2002. At last, the quantity of transported by rail end with the same point in the given year.
In sum, transported by road, water, and pipeline ballon, whereas the quantity of rail remained during the given period.
Goods transported in the UK
The graph below shows the quantities of goods transported in the UK between 1974 and 2002 by four different modes of transport.
The graph displays a million tonnes of transported by road, water, rail, and pipeline in the given country from 1974 to 2002.
The quantity of both road and pipeline showed an upward trend throughout this period. The amount of transported by pipeline generally climb from 5 to 20 million tonnes. Following a similar trend, despite a few drops, road transported soar to the peak of 100 million tonnes in 2002.
In contrast, the amount of transport by water and rail had the opposite trend at the beginning. Interestingly, it both starts at 40 million tonnes, but people eventually used 65 million tonnes times of water in 2002. At last, the quantity of transported by rail end with the same point in the given year.
In sum, transported by road, water, and pipeline ballon, whereas the quantity of rail remained during the given period.

1a445fc0617.jpg
