ashleycyw
Aug 30, 2019
Writing Feedback / The graphs show the result of a survey of computer ownership total and by education level [2]
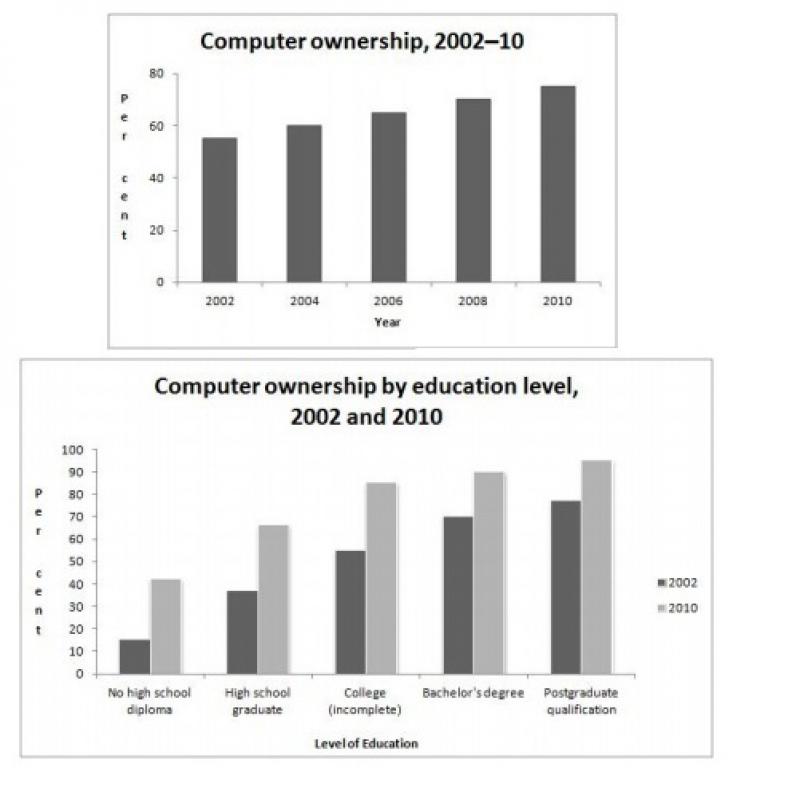
The graphs show us the result of a survey of computer ownership and computer ownership by education level as a percentage of the population between 2002 and 2010.
Generally speaking, there was a slight increase from 2002 to 2010. The percentage of 2010 computer ownership has almost 80 percent, 2010 has the highest percentage of computer ownership while 2002 has only almost 60 percent, that was the smallest percentage of computer ownership between the year of 2002 to 2010.
As is illustrated in the second graph, the Postgraduate qualification has the highest percentage among the 5 levels of education, whether in 2002 (70 percent) or 2010 (90 percent). It is interesting to note that the percentage of Bachelor's degree in 2002 has the same percentage of High school graduate in 2010 (almost 70 percent).
In summary, it is clear that 2010 are more likely to have computer ownership by five education levels.
computer ownership 2002-2010 statistics
The graphs show us the result of a survey of computer ownership and computer ownership by education level as a percentage of the population between 2002 and 2010.
Generally speaking, there was a slight increase from 2002 to 2010. The percentage of 2010 computer ownership has almost 80 percent, 2010 has the highest percentage of computer ownership while 2002 has only almost 60 percent, that was the smallest percentage of computer ownership between the year of 2002 to 2010.
As is illustrated in the second graph, the Postgraduate qualification has the highest percentage among the 5 levels of education, whether in 2002 (70 percent) or 2010 (90 percent). It is interesting to note that the percentage of Bachelor's degree in 2002 has the same percentage of High school graduate in 2010 (almost 70 percent).
In summary, it is clear that 2010 are more likely to have computer ownership by five education levels.

ac_writing.jpg
