Khanh1234
Sep 23, 2019
Writing Feedback / IELTS WRITING- Pie chart- electricity Generation [2]
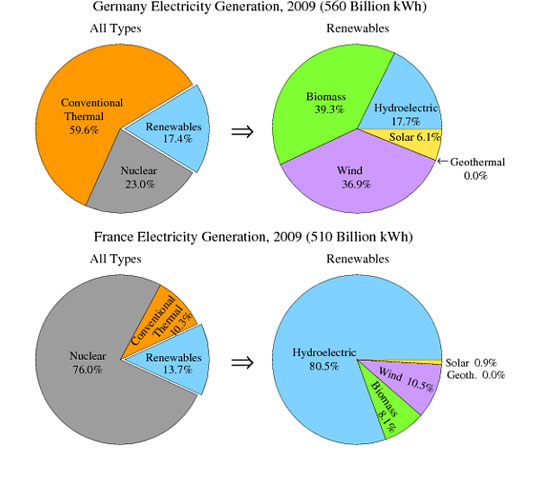
The pie charts show the electricity generated in Germany and France from all sources and renewable in the year 2009.
Summarise the information by selecting and reporting the main features, and make comparisons where relevant.
Write at least 150 words
The pie charts illustrate the differences of electricity produced between Germany and France in terms of all sources and renewables in 2009.
Overall, Germany produced more electricity than France. It is also noted that, while Conventional Thermal was by far the most popular energy in Germany, French showed their interest in Nuclear power.
In the year of 2009, the electricity generated in Germany was 560 Billion kWh, which was merely higher than that of France, a difference of 50 Billion kWh. In all types, most electricity generated in Germany comes from Conventional Thermal energy, at 59,6%. By contrast, there was just one-ten of Conventional Thermal energy used in France. As can be seen, Nuclear power featured at 76% of the total electricity generation in France, making it the first rank. Whereas, France just derived over a fifth of its electricity from Nuclear power. Besides, the amounts of Renewable in Germany and France constituted relatively similar figures at 17.4% and 13.7% respectively.
Turning to Renewable energy. In Germany, the top scorer and the runner-up, belonging to Biomass(39.3%) and (36.9%) in that order. They were by far higher than the remaining kinds of energy namely Hydroelectric & Solar, totaling about 24%. A reverse pattern can be seen in France, the electricity sector is dominated by Hydroelectric, which accounted for four-fifth of the total renewable energy, far exceeding Wind, Biomass, Solar, with the figures for them were 10.5%; 8.1%; and 0.9% accordingly.It is also noticeable that none of both nations which exploited geothermal energy.

ieltspiechartelec.jpg
