janenat
Oct 24, 2019
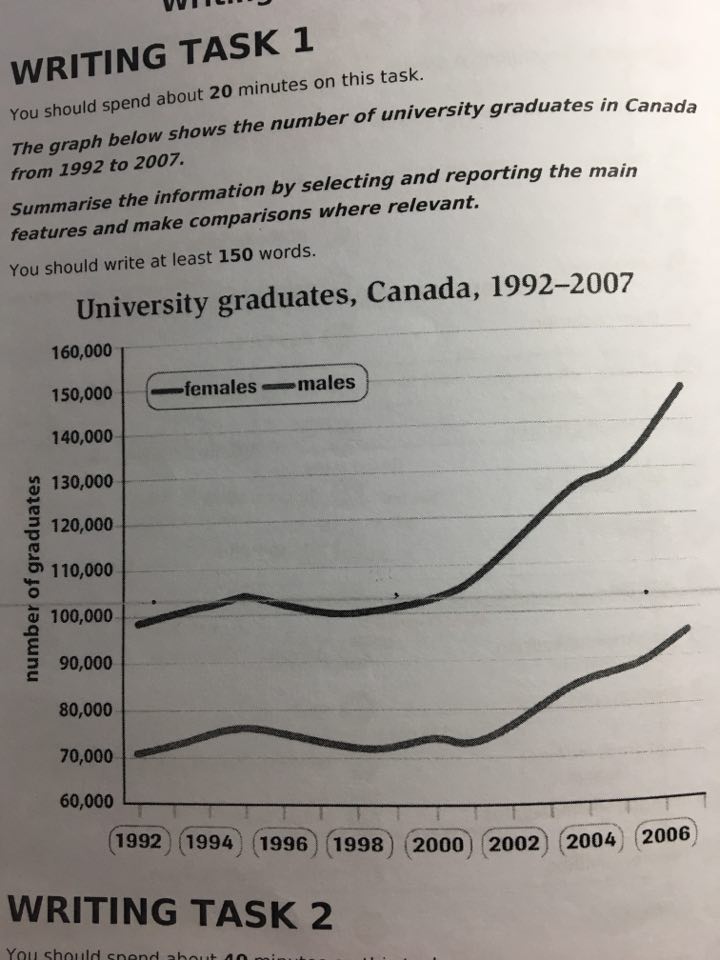
Writing Feedback / The graph below demonstrates the statistics of university graduates in Canada from 1992 to 2007 [3]
The line graph demonstrates the changes in the figure of graduate students of two genders, namely females and males, in Canadian universities over a course of 15 years started in 1992.
Generally, it is clearly evident that the pattern of the quantity of graduates from both groups differed sharply over the time frame. The numbers of students graduating from university in both genders witnessed an upward trend, especially females. By the end of the period, that of females had registered the highest figure out of all groups studied.
In 1992, the quantity of girls completing the university study programs was the highest of all two, standing around 100000 students. The year 1995 saw a slight rose in this figure to about 105000 students, before decreasing to 100000 graduates in 1998. During the period between 1998 and 2006, there was a sharp increase to approximately 150000 girls.
A similar trend could be seen in the numbers of graduate students who is boys, which was reported to be just over 70000 graduates in 1992, before
rising significantly to over 95000 students at the end of the period shown.
numbers of canadian graduate students
The line graph demonstrates the changes in the figure of graduate students of two genders, namely females and males, in Canadian universities over a course of 15 years started in 1992.
Generally, it is clearly evident that the pattern of the quantity of graduates from both groups differed sharply over the time frame. The numbers of students graduating from university in both genders witnessed an upward trend, especially females. By the end of the period, that of females had registered the highest figure out of all groups studied.
In 1992, the quantity of girls completing the university study programs was the highest of all two, standing around 100000 students. The year 1995 saw a slight rose in this figure to about 105000 students, before decreasing to 100000 graduates in 1998. During the period between 1998 and 2006, there was a sharp increase to approximately 150000 girls.
A similar trend could be seen in the numbers of graduate students who is boys, which was reported to be just over 70000 graduates in 1992, before
rising significantly to over 95000 students at the end of the period shown.

73533044_29066866460.jpg
