WaddahHamzah
Dec 12, 2019
Writing Feedback / The comparison of user involvement for four different online social platforms [3]
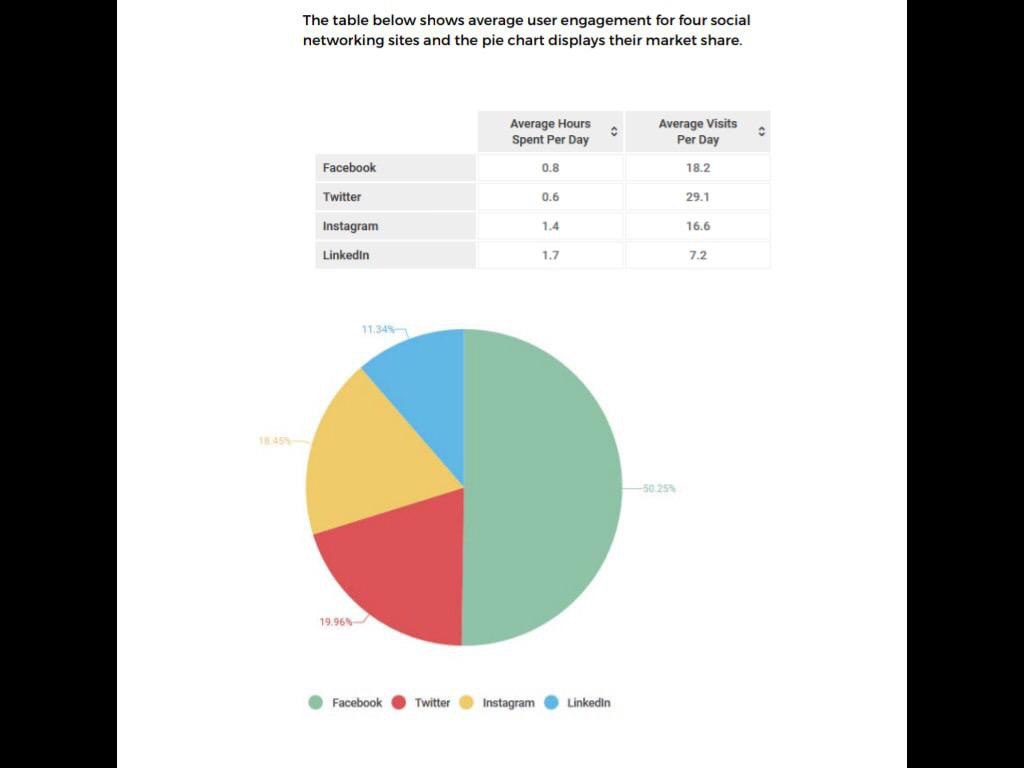
The table illustrates the comparison of user involvement for four different online social platforms, while the percentage of their market share is given in the chart.
In every day, most people prefer to visit Twitter more often with average at 29,1 times, which indicates it as the most favourite social platform, while the number of facebook daily visits is accounted as the second position. However, those users spend the minimum hours per day for accessing both social media. Also, Facebook dominates market share successfully with more than a half percentage, and this contrasts to the other networking sites.
As the remaining social networking platforms, LinkedIn and Instagram are being accessed for the longer times rather than the previous ones, however, the average of daily visits shows the reverse with only 16.6 for the former and 7.2 for the latter. When it comes to the market, both of them also have the lowest percentage with around 12% and 19% respectively.
Overall, Twitter is the most preferable social media since it has the highest rate of daily visits, followed by Facebook which has dominated the market share. Whilst the LinkedIn has the highest proportion of time passed per day, the number of its visits experienced the lowest rate as well as Instagram.
Writing Task 1 IELTS Social Media
The table illustrates the comparison of user involvement for four different online social platforms, while the percentage of their market share is given in the chart.
In every day, most people prefer to visit Twitter more often with average at 29,1 times, which indicates it as the most favourite social platform, while the number of facebook daily visits is accounted as the second position. However, those users spend the minimum hours per day for accessing both social media. Also, Facebook dominates market share successfully with more than a half percentage, and this contrasts to the other networking sites.
As the remaining social networking platforms, LinkedIn and Instagram are being accessed for the longer times rather than the previous ones, however, the average of daily visits shows the reverse with only 16.6 for the former and 7.2 for the latter. When it comes to the market, both of them also have the lowest percentage with around 12% and 19% respectively.
Overall, Twitter is the most preferable social media since it has the highest rate of daily visits, followed by Facebook which has dominated the market share. Whilst the LinkedIn has the highest proportion of time passed per day, the number of its visits experienced the lowest rate as well as Instagram.

TableandChartso.png
