PsycRicky
Jan 12, 2020
Writing Feedback / IELTS WRITING TASK 1 - Car theft, house burgling and street robbery - statistics in two countries [4]
Hello! Please give me some advice to improve my expression. I want to know whether am I express my thought in authentic real English or not and how to correctmy defect. Thanks a lot.
TOPIC:
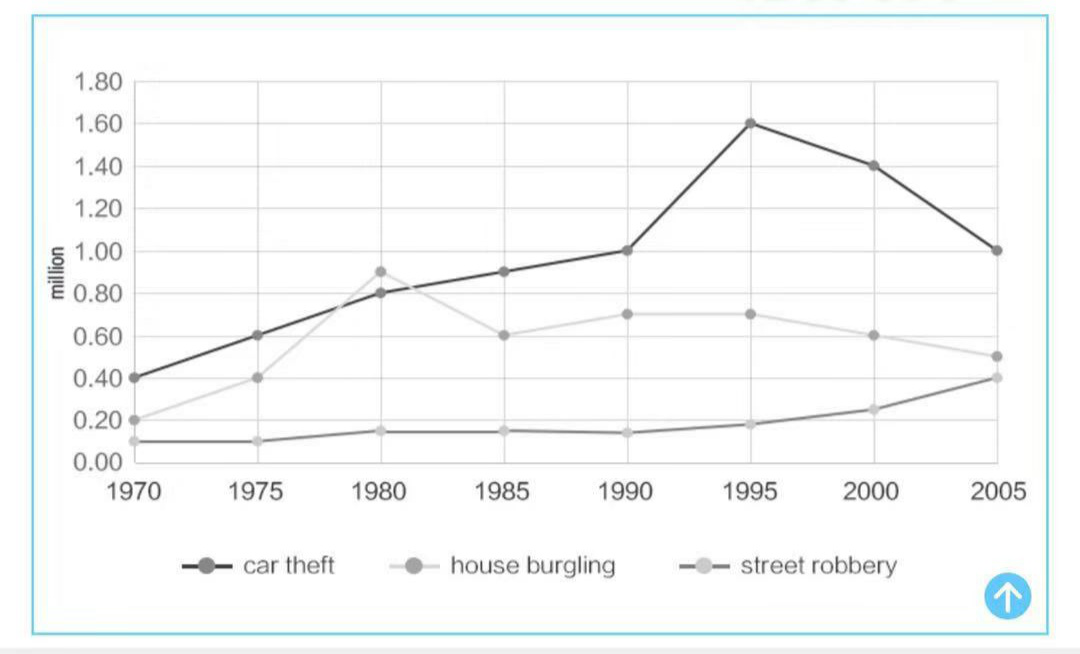
The chart below shows three different crimes and the number of cases committed between 1970 and 2005 in England and Wales. Summarise the information by selecting and reporting the main features, and make comparisons where relevant.
The line graph presents information about three kinds of crimes and the quantity of cases committed between 1970 and 2005 in England and Wales.
The major form of crime was car theft throughout the period, except in 1980 replaced by house burgling. There was a gradually increase from 0.4 million in 1970 in car theft. After peaking at 1.6 million in 1995, it considerably declined to 1 million in 2005. As rapid growing from 1970, house burgling peaked at 0.9 million in 1980. For the first time, it became the major form of crime. Then there was a downward trend, declining to 0.5 million in 2005, although it rebound slightly between 1985 and 1995.
35 years witnessed climbed Street robbery at 0.1 million from 1970, reaching its peak at 0.4 million. The number of street robbery was only less than that of house burgling by 20% in 2005. In 2005, the number of car theft was largest (1 million), followed by house burgling (0.5 million) and street robbery (0.4 million).
Overall, during 35 years the number of all types of crime increased in different rate. Car theft was still the most serious problem among the three various crimes. Although the number of street robbery always was least, it continuously rise in last decade.
Hello! Please give me some advice to improve my expression. I want to know whether am I express my thought in authentic real English or not and how to correctmy defect. Thanks a lot.
The chart and graph summary
TOPIC:
The chart below shows three different crimes and the number of cases committed between 1970 and 2005 in England and Wales. Summarise the information by selecting and reporting the main features, and make comparisons where relevant.
The line graph presents information about three kinds of crimes and the quantity of cases committed between 1970 and 2005 in England and Wales.
The major form of crime was car theft throughout the period, except in 1980 replaced by house burgling. There was a gradually increase from 0.4 million in 1970 in car theft. After peaking at 1.6 million in 1995, it considerably declined to 1 million in 2005. As rapid growing from 1970, house burgling peaked at 0.9 million in 1980. For the first time, it became the major form of crime. Then there was a downward trend, declining to 0.5 million in 2005, although it rebound slightly between 1985 and 1995.
35 years witnessed climbed Street robbery at 0.1 million from 1970, reaching its peak at 0.4 million. The number of street robbery was only less than that of house burgling by 20% in 2005. In 2005, the number of car theft was largest (1 million), followed by house burgling (0.5 million) and street robbery (0.4 million).
Overall, during 35 years the number of all types of crime increased in different rate. Car theft was still the most serious problem among the three various crimes. Although the number of street robbery always was least, it continuously rise in last decade.

1.png
