tranngoccau123
Aug 3, 2020
Writing Feedback / IELTS TASK 1 WRITING: WORLD'S WATER AND USE OF WATER FOR ECONOMIC SECTORS [3]
Task 1: The charts below show the distribution of the world's water and the use of water in three countries.
Summarize the information by selecting and reporting the main features and make comparisons where relevant.
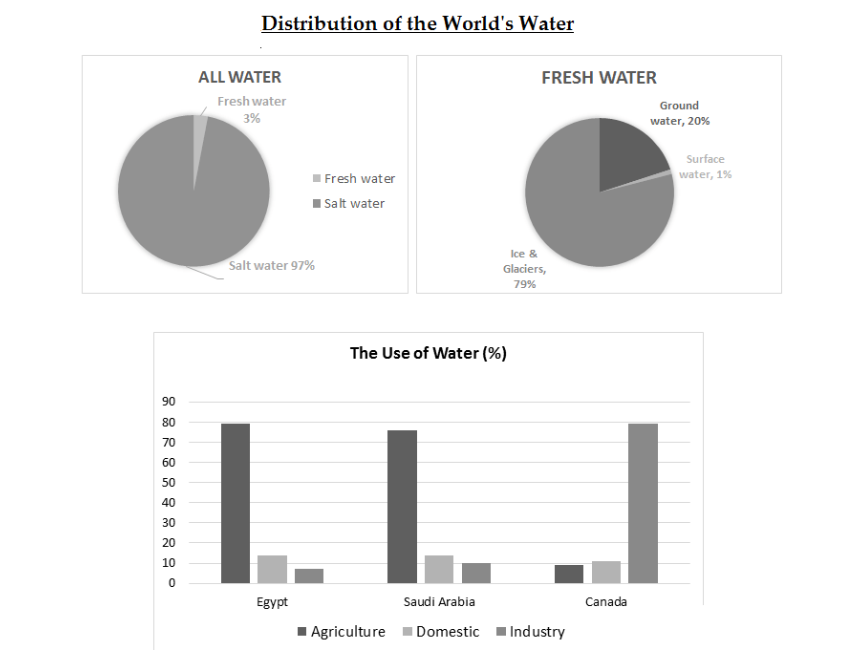
The charts illustrate the proportion of natural resources which distribute to World's Water and the amount of water used for three economic sectors in Egypt, Saudi Arabia and Canada.
Overall, it is clear that fresh water accounts for the smallest share of the worldwide water, and it is mostly generated by Ice & Glaciers. Egypt has the highest water usage in agriculture whereas Canadians often use water for their Industry.
According to the two pie charts, salt water provided 97% of the world's water and the percentage of other ones is only 3%. Moreover, the amount of ice & glaciers used to synthesize fresh water is 79 times that of surface water and nearly 4 times as ground water.
As can be seen from the bar graph, Egyptians prefer to spend most of their water usage in Agriculture by 80%, in contrast to about 10% of the water consumption in Industry. Citizens who come from Saudi Arabia not only have a second tendency to use water in the agricultural field but also the second consumption in Industry after Canada (the highest ones with 80%).
distribution of the world's water
Task 1: The charts below show the distribution of the world's water and the use of water in three countries.
Summarize the information by selecting and reporting the main features and make comparisons where relevant.
The charts illustrate the proportion of natural resources which distribute to World's Water and the amount of water used for three economic sectors in Egypt, Saudi Arabia and Canada.
Overall, it is clear that fresh water accounts for the smallest share of the worldwide water, and it is mostly generated by Ice & Glaciers. Egypt has the highest water usage in agriculture whereas Canadians often use water for their Industry.
According to the two pie charts, salt water provided 97% of the world's water and the percentage of other ones is only 3%. Moreover, the amount of ice & glaciers used to synthesize fresh water is 79 times that of surface water and nearly 4 times as ground water.
As can be seen from the bar graph, Egyptians prefer to spend most of their water usage in Agriculture by 80%, in contrast to about 10% of the water consumption in Industry. Citizens who come from Saudi Arabia not only have a second tendency to use water in the agricultural field but also the second consumption in Industry after Canada (the highest ones with 80%).

3.8.2020.png
