Phamthihaiha
Aug 24, 2020
Writing Feedback / Ielts writing task 1: The line graph illustrates fluctuations in China's and the US birth rates [3]
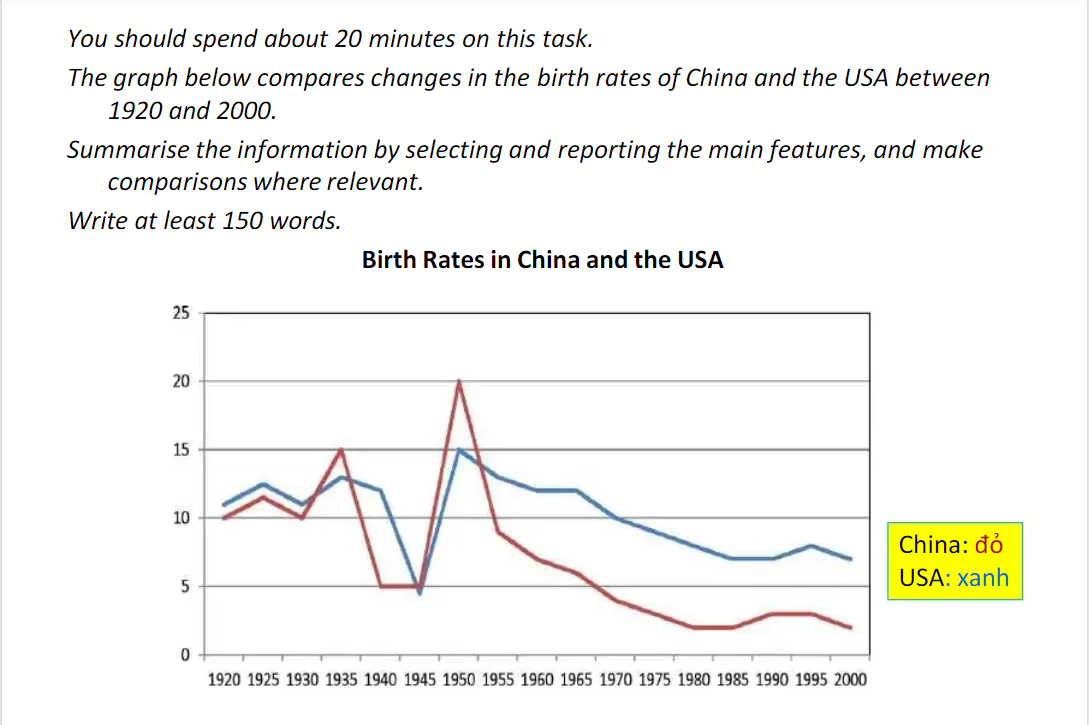
The line graph illustrates fluctuations in China's and the US birth rates from 1920 to 2000.
As can be seen from the chart, both the USA and China experienced a global downward trend by varying degrees in the birth rates. However, the birth rate of the USA in most years was higher than that of China.
The birth rates in the US fluctuated around 12% in the 1920-1935 period before decreasing dramatically to below 5% in 1945. In contrast, there was a sharp increase to exactly 15% in 1950, which was its highest point during the 80-year period, followed by a gradual decrease to 7% in the last year in the birth rate of the US.
Over the same period, the birth rate in China varied more significantly than in the US. After witnessing volatility in the first 15 years, the birth rate of China fell substantially by 10% in 1940, after which the period until 1945 unchanged. On the other hand, it grew steeply by 15% to reach a peak of 20% in 1950, compared with a rapid decline of approximately 20% from 1950 onwards.
The Analysis of Birth Statistics
The line graph illustrates fluctuations in China's and the US birth rates from 1920 to 2000.
As can be seen from the chart, both the USA and China experienced a global downward trend by varying degrees in the birth rates. However, the birth rate of the USA in most years was higher than that of China.
The birth rates in the US fluctuated around 12% in the 1920-1935 period before decreasing dramatically to below 5% in 1945. In contrast, there was a sharp increase to exactly 15% in 1950, which was its highest point during the 80-year period, followed by a gradual decrease to 7% in the last year in the birth rate of the US.
Over the same period, the birth rate in China varied more significantly than in the US. After witnessing volatility in the first 15 years, the birth rate of China fell substantially by 10% in 1940, after which the period until 1945 unchanged. On the other hand, it grew steeply by 15% to reach a peak of 20% in 1950, compared with a rapid decline of approximately 20% from 1950 onwards.

task1trend..png
