thanhtien2512
Jun 7, 2021
Writing Feedback / Writing task 1: The amount of fish and meat consumed in a European country from 1979 to 2004 [3]
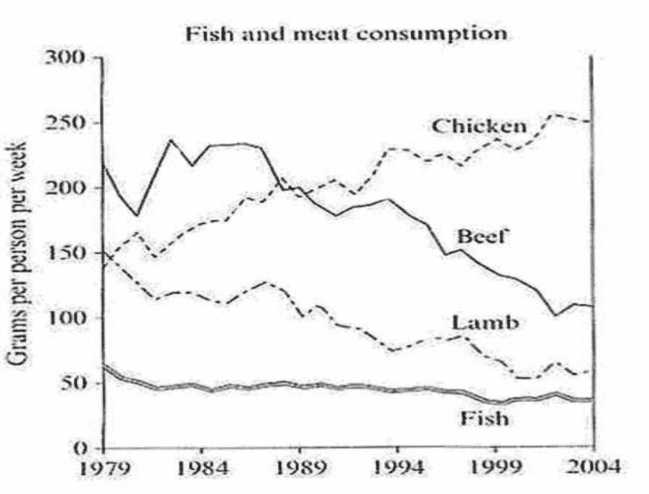
The graph illustrates the amount of fish and meat consumed in a Europan country over a period of 25 years.
Among 4 categories, it can be seen that there was a downward trend in the consumption of fish and different types of meat, except for chicken consumption. In addition, fish was always the least favorite type consumed throughout the period.
Overall, if we look at the consumption of beef and lamb, these two figures shared a similarity. They both sustainably decreased over the period shown. More specifically, beef consumption dropped by haft from about 230 down to more than 100 over the 1979 to 2004 period. Meanwhile, the figure for lamb fell from 150 to approximately 60 during the period.
On the other hand, the amount of chicken consumed witnessed a noticeably increase from nearly 150 to a peak of roughly 250 grams per person weekly, making chicken be the most favored type. Meanwhile, there was a marginal drop in fish consumption in the first year of the period. Then, the figure remained stable at about 50 grams later over the years.
AN COMPARISON BETWEEN DIFFERENT TYPES OF MEAT IN A EUROPEAN COUNTRY
The graph illustrates the amount of fish and meat consumed in a Europan country over a period of 25 years.
Among 4 categories, it can be seen that there was a downward trend in the consumption of fish and different types of meat, except for chicken consumption. In addition, fish was always the least favorite type consumed throughout the period.
Overall, if we look at the consumption of beef and lamb, these two figures shared a similarity. They both sustainably decreased over the period shown. More specifically, beef consumption dropped by haft from about 230 down to more than 100 over the 1979 to 2004 period. Meanwhile, the figure for lamb fell from 150 to approximately 60 during the period.
On the other hand, the amount of chicken consumed witnessed a noticeably increase from nearly 150 to a peak of roughly 250 grams per person weekly, making chicken be the most favored type. Meanwhile, there was a marginal drop in fish consumption in the first year of the period. Then, the figure remained stable at about 50 grams later over the years.

task1cam7test2.pn.png
