banngoc16
Jun 6, 2021
Writing Feedback / The line chart illustrates the proportion of visitors who went to four distinct places in Edinburg [3]
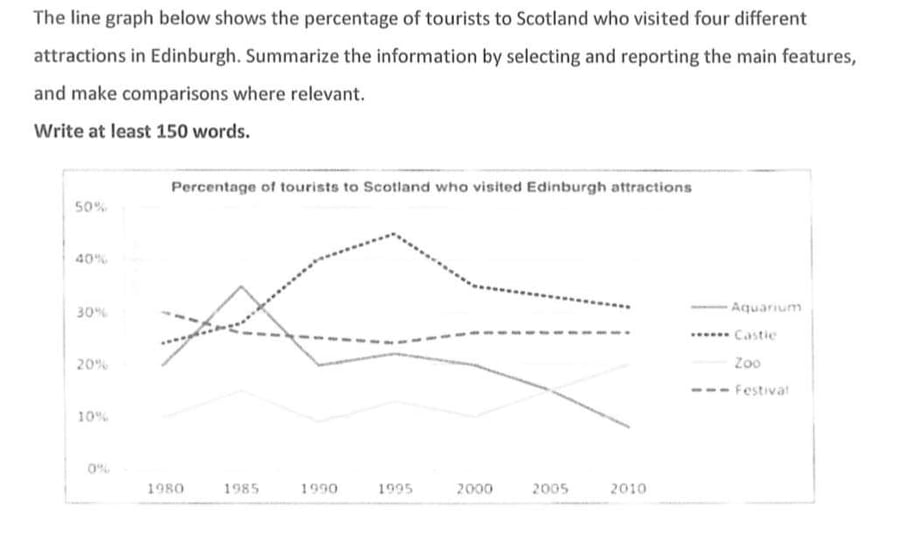
The line chart illustrates the proportion of visitors who went to four distinct destinations in Edinburg, Scotland.
Overall, the number of tourists visiting zoo and castle showed an upward trend, whereas that of aquarium and festival followed a downward trend.
From 1980 to 1985, the percentage of visitors to both places underwent a modest rise. Between 1985 and 2000, a period of 15 years, that of castle witnessed a dramatic surge, outstripped the number of aquarium tourists and peaked at 45 percent in the year 1995. Meanwhile, that of zoo fluctuated slightly. Then, from 2000 to 2010, the tourists coming to zoo rise considerably and eventually surpassed that of aquarium in 2005. In sharp contrast to this, the percentage of visitors coming to castle slowly declined.
Between 1980 and 1985, the number of visitors to aquarium suddenly rose to about 35 percent, while that of festival witnessed a mild decline. From 1985 to 2000, the percentage of tourists coming to festival experienced a gentle fluctuation, then, to the rest of the timescale, it reached a plateau of about 25 percent. Meanwhile, that of aquarium witnessed a sharp fall from 1985 to 1990, a period of 5 years. In the next 5 years, it rose slight. After that, from 1995 to the end of the timescale, it experienced a marked plunge.
tourists in Edinburgh
The line chart illustrates the proportion of visitors who went to four distinct destinations in Edinburg, Scotland.
Overall, the number of tourists visiting zoo and castle showed an upward trend, whereas that of aquarium and festival followed a downward trend.
From 1980 to 1985, the percentage of visitors to both places underwent a modest rise. Between 1985 and 2000, a period of 15 years, that of castle witnessed a dramatic surge, outstripped the number of aquarium tourists and peaked at 45 percent in the year 1995. Meanwhile, that of zoo fluctuated slightly. Then, from 2000 to 2010, the tourists coming to zoo rise considerably and eventually surpassed that of aquarium in 2005. In sharp contrast to this, the percentage of visitors coming to castle slowly declined.
Between 1980 and 1985, the number of visitors to aquarium suddenly rose to about 35 percent, while that of festival witnessed a mild decline. From 1985 to 2000, the percentage of tourists coming to festival experienced a gentle fluctuation, then, to the rest of the timescale, it reached a plateau of about 25 percent. Meanwhile, that of aquarium witnessed a sharp fall from 1985 to 1990, a period of 5 years. In the next 5 years, it rose slight. After that, from 1995 to the end of the timescale, it experienced a marked plunge.

task1linechart.jp.jpg