Dangtoloan
Jul 29, 2021
Writing Feedback / Households with electrical appliances in one country and the length of time doing chore per week [4]
Topic:
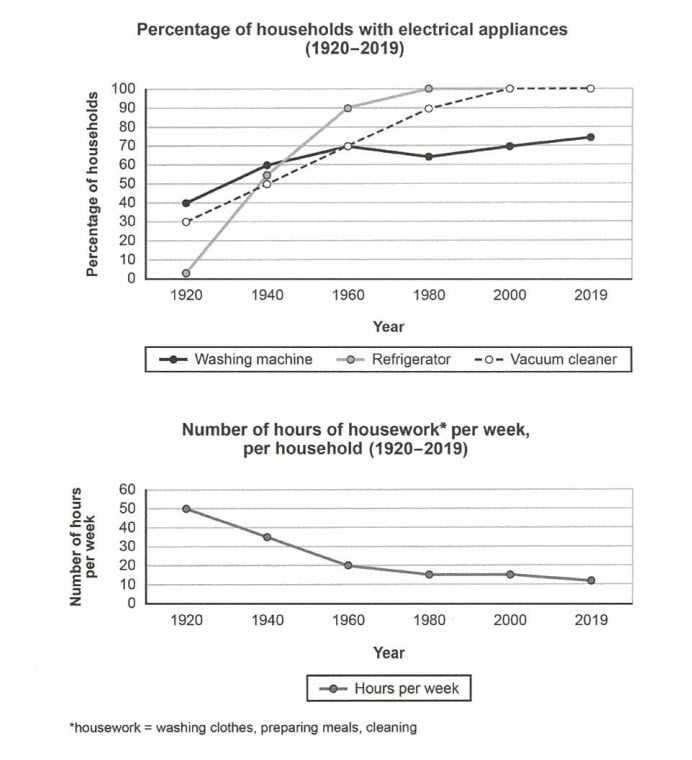
The charts below show the changes in ownership of electrical appliances and amount of time spent doing housework in households in one country between 1920 and 2019.
Summarise the information by selecting and reporting the main features, and make comparisons where relevant.
The given charts detail the percentages of households that have possession of electrical appliances in one country and the length of time they spend doing chore per week between 1920 and 2019.
Looking from an overall perspective, the popularity of using electrical appliances has increased incredibly, especially refrigerators and vacuum cleaners in the last one hundred years. Futhermore, the total time to do housework has appeared to decline dramatically during the same period.
In particular, the first linechart shows that the proportion of the ownership of washing machines was the largest in 1920 (40%) . Then this figure has fluctuated slightly around 65% and went up to reach 70% but still ranked the last at the end of the period. In contrast, almost no households has a refrigerator in 1920. However, the consumption of refrigerators surged to more than 50% by 1940 then continued to rise steadily over next 20 years to 100% in 1980 and remained until 2019.Lastly, there was nearly a third of households that possessed vacuum cleaners in 1920. After that, the number climbed moderately every 20 years and finally reached 100% in 2000.
In additon, it seems the result for taking the advantage of using technology was that the time doing houseworks fell steadily from 50 hours per week in 1920 to 20 by 1960. After that, the decline was more gradual, reaching slightly above 10 hours by 2019.
Summarise the information from the charts provided
Topic:
The charts below show the changes in ownership of electrical appliances and amount of time spent doing housework in households in one country between 1920 and 2019.
Summarise the information by selecting and reporting the main features, and make comparisons where relevant.
The given charts detail the percentages of households that have possession of electrical appliances in one country and the length of time they spend doing chore per week between 1920 and 2019.
Looking from an overall perspective, the popularity of using electrical appliances has increased incredibly, especially refrigerators and vacuum cleaners in the last one hundred years. Futhermore, the total time to do housework has appeared to decline dramatically during the same period.
In particular, the first linechart shows that the proportion of the ownership of washing machines was the largest in 1920 (40%) . Then this figure has fluctuated slightly around 65% and went up to reach 70% but still ranked the last at the end of the period. In contrast, almost no households has a refrigerator in 1920. However, the consumption of refrigerators surged to more than 50% by 1940 then continued to rise steadily over next 20 years to 100% in 1980 and remained until 2019.Lastly, there was nearly a third of households that possessed vacuum cleaners in 1920. After that, the number climbed moderately every 20 years and finally reached 100% in 2000.
In additon, it seems the result for taking the advantage of using technology was that the time doing houseworks fell steadily from 50 hours per week in 1920 to 20 by 1960. After that, the decline was more gradual, reaching slightly above 10 hours by 2019.

91E9D67BCEE241BAA.jpeg
