QuocDuong
Aug 30, 2021
Writing Feedback / The line graph article. IELTS task 1. Railway trips time in UK [2]
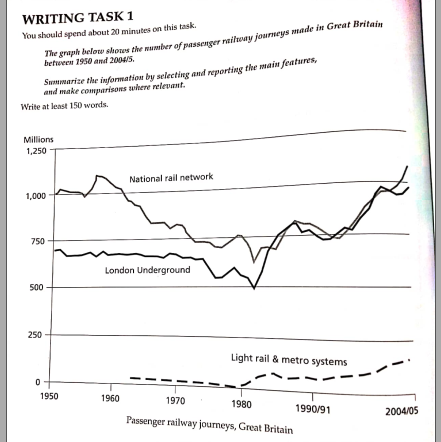
The given line graph illustrates how many passenger spent on railway trips made in the United Kingdom over a period of 55 years, starting from 1950.
Overall, it is abvious that the number of passenger spent on railway journeys in all mentioned rail saw an upward trend over the period shown. Moreover, the figure for National rail network is highest.
The number of passenger of National rail work decreaed gradually from 1000m to around 750m from 1950 to 1980. There was a slight fluctuation in the quantity of passenger used to take on London Underground from 1950 to 1980. A slight drop was seen in the number of passenger spent on Light Rail and Metro Systems from about 1963 to 1980.
In addition, the number of passenger expended of the Naional rail work from 1980 to 2004/5 was a moderate growth from about 750m to 1100m. In terms of passenger, the London Underground witnessed a significant rocket from about 550m to almost 1000m from 1980 to 2004/05. It can be seen that the numeber of passenger who had used Light rail anđ Metro systems was gradually increase.
The number of passenger railway journeys
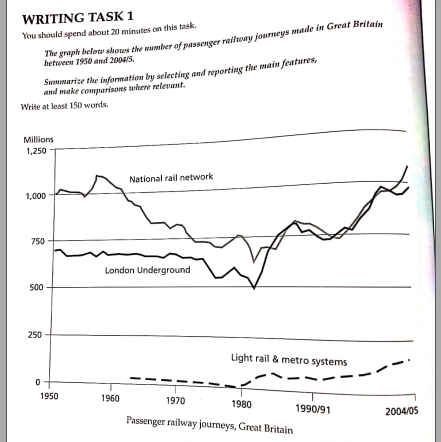
The given line graph illustrates how many passenger spent on railway trips made in the United Kingdom over a period of 55 years, starting from 1950.
Overall, it is abvious that the number of passenger spent on railway journeys in all mentioned rail saw an upward trend over the period shown. Moreover, the figure for National rail network is highest.
The number of passenger of National rail work decreaed gradually from 1000m to around 750m from 1950 to 1980. There was a slight fluctuation in the quantity of passenger used to take on London Underground from 1950 to 1980. A slight drop was seen in the number of passenger spent on Light Rail and Metro Systems from about 1963 to 1980.
In addition, the number of passenger expended of the Naional rail work from 1980 to 2004/5 was a moderate growth from about 750m to 1100m. In terms of passenger, the London Underground witnessed a significant rocket from about 550m to almost 1000m from 1980 to 2004/05. It can be seen that the numeber of passenger who had used Light rail anđ Metro systems was gradually increase.

1.png
1.png