theloner1999
Oct 9, 2021
Writing Feedback / Sample Answer Essay IELTS Cambridge 15: Coffee and Tea Buying and Drinking Habits [2]
Writing Task 1 The chart below shows the results of a survey about people's coffee and tea buying
Sample Answer Essay IELTS Cambridge 15: Coffee and Tea Buying and Drinking Habits (Cambridge IELTS 15)
The chart below shows the results of a survey about people's coffee and tea buying and drinking habits in five Australian cities.
Summaries the information by selecting and reporting the main features, and make comparisons where relevant.
Write at least 150 words.
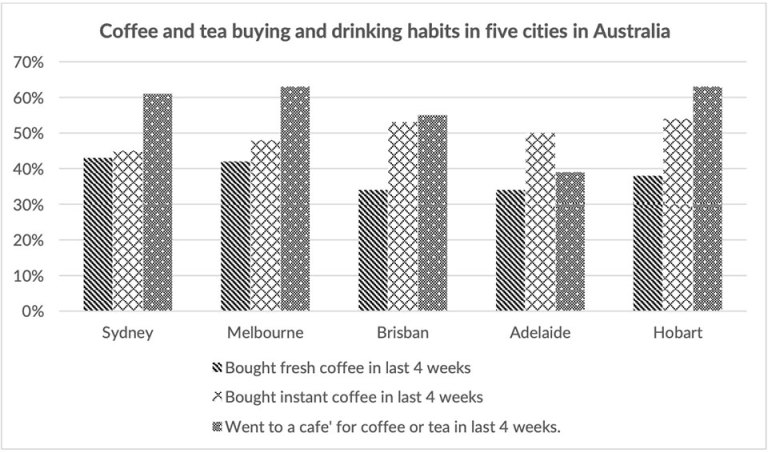
The graphic presentation illustrates the finding percentage of people purchasing and consuming coffee and tea in 5 different urban areas around Australia. Overall, what stands out from the chart is purchased fresh coffee in the last four weeks was the least popular activity whereas went to the coffee shop is the most popular in the given cities.
The peaking point of went to the coffee shop in about 1 month is in Melbourne at about 65%, in contrast, the lowest point is in Adelaide where it only reached about 50%. Consumed instant coffee in four weeks is fairly popular around the given area as it is the second most popular factor with the only exception is in Adelaide where it outweighs the number of people who went to the cafe for coffee or tea and become the prominent factor there however the highest proportion is in Brisbane where it reaches over 50%. The number of people who used fresh coffee in the last 4 weeks reaches the highest point in Sydney at about 45% while Brisbane and Adelaide witness the least popular figure in this category at about 33% and 34% respectively.

writingtask1answe.jpg
