Cadeyhere
Oct 29, 2021
Writing Feedback / Petrol and Oil - Writing task 1 : Line Graph. [2]
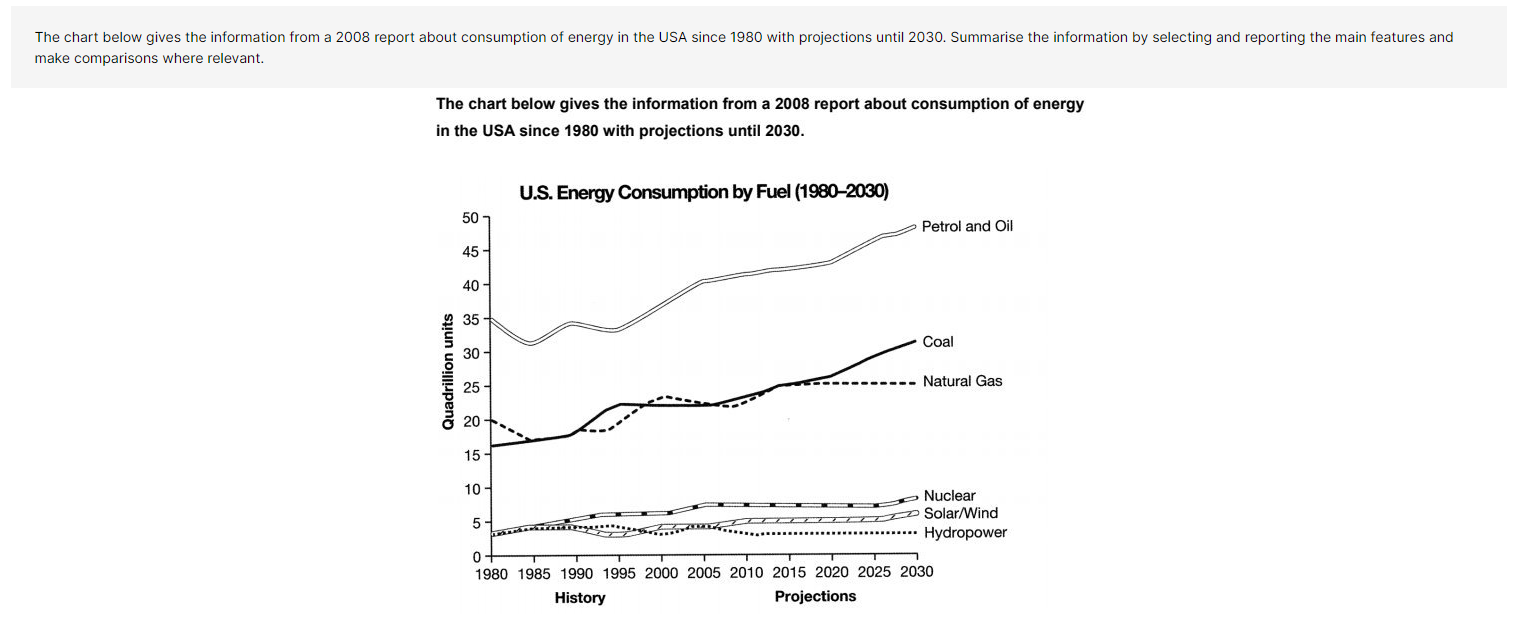
The line graph illustrates the amount of quadrillion units energy consumed in the USA with predictations from 1980 to 2030. Overall, while three resources including Petrol and Oil, Coal and Natural Gas dramatically increase, those of other energy witness 5 decades of stability.
Petrol and Oil is the resource that was consumed the highest amount of quadrillion units throughout the timescale and was two times more than Coal and Natural Gas in 1890. In the first 28 years of the timescale, the Petrol and Oil energy underwent a period of instability from 30 to 40 quadrillion units before continuing to rise significantly to 50 quadrillion units in 2030. Similarly, the Natural Gas energy consumed saw a changable stage of 35 years between 1890 and 2015 until being surpassed by Coal at 17 quadrillion units in 1990, after which being predicted to remain stable at 25 quadrillion units for the last time of timescale. Likewise, Coal markedly climbe from 15 to 30 quadrillion units during 5 decades and become the second preferred energy resource after Petrol and Oil.
By contrast, the consumption of Nuclear, Solar/ Wind and Hydropower vary insignificantly from 4 to 6 quadrillion units for all the time of the timescale and became the most unpopular resources. After 50 years, the Petrol and Oil still is preferred than other energy resources and be twice times more than Natural Gas in 2030.
us energy consumption by fuel
The line graph illustrates the amount of quadrillion units energy consumed in the USA with predictations from 1980 to 2030. Overall, while three resources including Petrol and Oil, Coal and Natural Gas dramatically increase, those of other energy witness 5 decades of stability.
Petrol and Oil is the resource that was consumed the highest amount of quadrillion units throughout the timescale and was two times more than Coal and Natural Gas in 1890. In the first 28 years of the timescale, the Petrol and Oil energy underwent a period of instability from 30 to 40 quadrillion units before continuing to rise significantly to 50 quadrillion units in 2030. Similarly, the Natural Gas energy consumed saw a changable stage of 35 years between 1890 and 2015 until being surpassed by Coal at 17 quadrillion units in 1990, after which being predicted to remain stable at 25 quadrillion units for the last time of timescale. Likewise, Coal markedly climbe from 15 to 30 quadrillion units during 5 decades and become the second preferred energy resource after Petrol and Oil.
By contrast, the consumption of Nuclear, Solar/ Wind and Hydropower vary insignificantly from 4 to 6 quadrillion units for all the time of the timescale and became the most unpopular resources. After 50 years, the Petrol and Oil still is preferred than other energy resources and be twice times more than Natural Gas in 2030.

Capture.PNG
