kunstpm
Nov 7, 2021
Writing Feedback / Ielts graph about gold sales in Dubai during the year of 2002 [2]
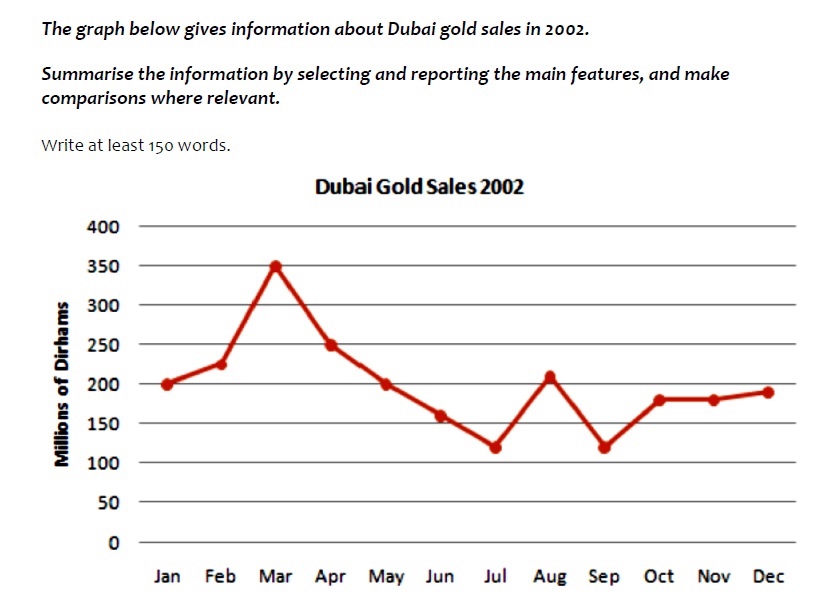
The line graph shows gold sales in Dubai during 2002. It's clear that the Dubai gold sales fluctuated throughout the year. As it is presented in the graph, the highest sales were in March while the lowest peak of the gold sales was in July and September.
As it is evident from the graph, 200 million of dirhams in January is a starting point. After that, the gold sales started to grow slightly, then reached the highest point in March about 350 million of dirhams. Ever since, it fell from 350 million in March to 120 million in July. However, there was a rise in 80 million in August that dropped in September. Then, the sales amount increased in October and continued to grow gradually to 200 million of dirhams in December. The figures remained unchanged in October and November and reached almost the same point as in the beginning of year about 200 million in December.
In conclusion, March, July, and September are months when the gold sales achieved the highest and the lowest points. But the sales remained stable from October to December.
The gold sales in Dubai
The line graph shows gold sales in Dubai during 2002. It's clear that the Dubai gold sales fluctuated throughout the year. As it is presented in the graph, the highest sales were in March while the lowest peak of the gold sales was in July and September.
As it is evident from the graph, 200 million of dirhams in January is a starting point. After that, the gold sales started to grow slightly, then reached the highest point in March about 350 million of dirhams. Ever since, it fell from 350 million in March to 120 million in July. However, there was a rise in 80 million in August that dropped in September. Then, the sales amount increased in October and continued to grow gradually to 200 million of dirhams in December. The figures remained unchanged in October and November and reached almost the same point as in the beginning of year about 200 million in December.
In conclusion, March, July, and September are months when the gold sales achieved the highest and the lowest points. But the sales remained stable from October to December.

SVJUaGYKrnA.jpg
