giangngoc
Jun 14, 2022
Writing Feedback / WT 1: (Pie Charts): Enrollment in different fields of study at a particular universities in 2021 [4]
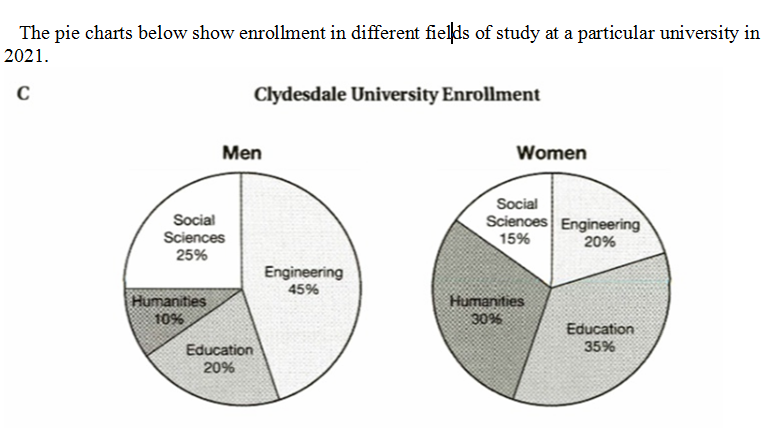
The charts illustrate the percentage of males and females who applied for some majors of study at Clydesdale University in 2021.
Overall, it is clear that both males and females enrolled in Engineering and Education, while Social Sciences and Humanities has an opposite trend.
The proportion of applications which were sorted the most by males was Engineering, at 45%; while females only accounted for a fifth of the total fields. In terms of education, the figures for females were the highest and occupied 15% more than males.
For the rest, females who registered in the field of Humanities were third as much as males, at 30% and 10% respectively. And Social sciences only 15% of women's registrations; while it made up a fourth of total men's enrollment.
The pie charts below show enrollment in different fields of study at a particular university in 2021.
The charts illustrate the percentage of males and females who applied for some majors of study at Clydesdale University in 2021.
Overall, it is clear that both males and females enrolled in Engineering and Education, while Social Sciences and Humanities has an opposite trend.
The proportion of applications which were sorted the most by males was Engineering, at 45%; while females only accounted for a fifth of the total fields. In terms of education, the figures for females were the highest and occupied 15% more than males.
For the rest, females who registered in the field of Humanities were third as much as males, at 30% and 10% respectively. And Social sciences only 15% of women's registrations; while it made up a fourth of total men's enrollment.

Pie chart
